


Morning Brief

Headline News:
The S&P 500 futures are down 8 points and are trading 0.3% below fair value. The Nasdaq 100 futures are up 3 points and are trading 0.2% below fair value. The Dow Jones Industrial Average futures are down 109 points and are trading 0.3% below fair value.
Futures for the major indices are mixed with mixed reactions to a lot of earnings reports since yesterday’s close. There’s some central bank news in play this morning with market participants waiting on the ECB decision at 8:15 a.m. ET. The ECB is expected to raise its key lending rates by 25 basis points, although there has been some chatter that a 50 basis point increase could also be discussed. In either case, this will be the ECB’s first rate hike in 11 years.
Central bank outlier, the Bank of Japan, announced no change in its monetary policy. Its key lending rate remains unchanged at -0.1%. Japan’s central bank also lowered its GDP forecast to 2.4% from 2.9% while raising its inflation forecast to 1.3% from 0.9%.
Russia resumed gas flows to Europe through the Nord Stream 1 but at reduced volumes seen before the scheduled maintenance.
Italian Prime Minister Draghi resigned after he was unable to resume a coalition government, setting the stage for early elections.
Energy complex futures have made big moves to the downside. WTI crude oil futures are down 4.8% to $95.10/bbl. Unleaded gasoline futures are down 6.2% to $3.07/gal. Natural gas futures are down 3.8% to $7.60/mmbtu. Separately, cryptocurrencies are also under pressure following Tesla’s disclosure that it converted 75% of its Bitcoin holdings to fiat currency. The weakness, though, comes after a big move to the upside in recent weeks.
(Michael Gibbs, Director of Equity Portfolio & Technical Strategy)
Markets:
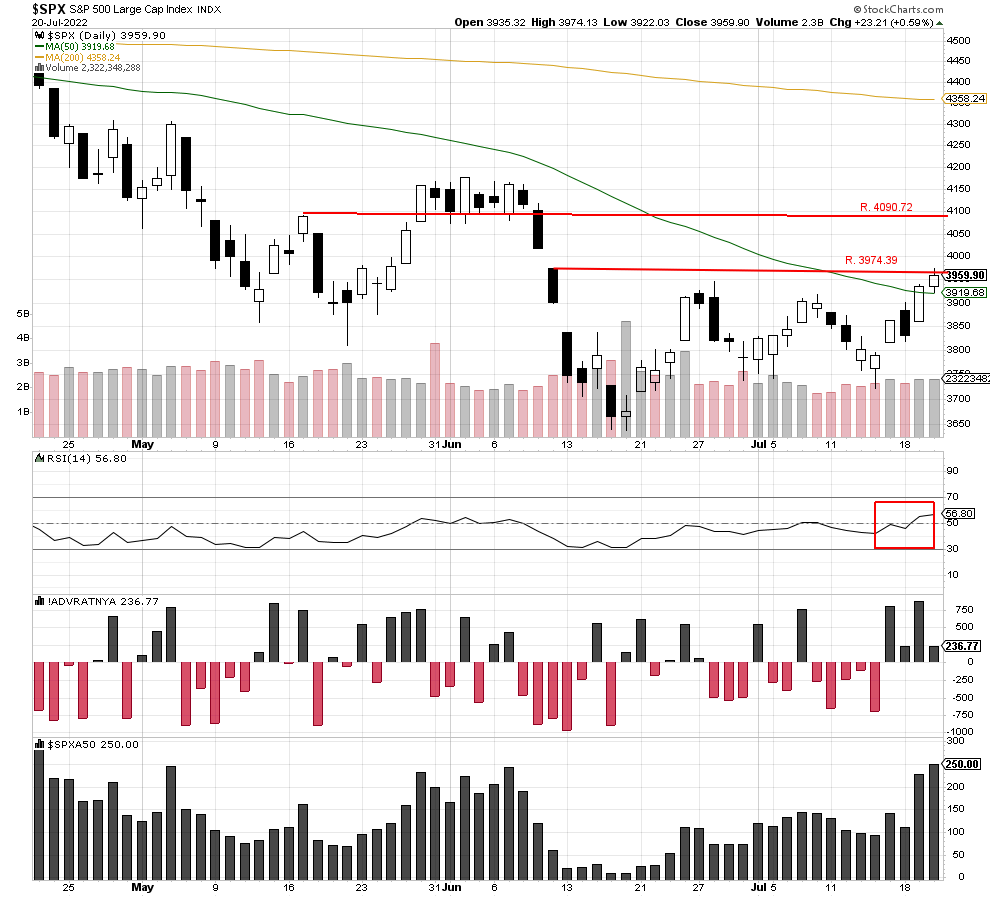
The S&P 500 held above the 50-day moving average of 3919.68 and closed higher at 3959.90. Although volume was only average at 2,322,348,288, the fact the index rallied again after Wednesday’s large rally is impressive. RSI closed at 56.80 for the first time since mid-June to support the rally.
Today, there could potentially be strong resistance at 3974.39, and we believe the index can close above that level today as better-than-expected corporate earnings reports are released.
We are currently Intermediate-term bearish and short-term bearish.
John N. Lilly III CPFA
Accredited Portfolio Management Advisor℠
Accredited Asset Management Specialist℠
Portfolio Manager, RJFS
Partner, DJWMG
Windsor Wealth Planners & Strategist
Futures trading is speculative, leveraged, and involves substantial risks. Investing always involves risk, including the loss of principal, and futures trading could present additional risk based on underlying commodities investments.
The Relative Strength Index (RSI), developed by J. Welles Wilder, is a momentum oscillator that measures the speed and changes of price movements.
The advance/decline line (A/D) is a technical indicator that plots the difference between the number of advancing and declining stocks on a daily basis. The indicator is cumulative, with a positive number being added to the prior number, or if the number is negative it is subtracted from the prior number.
The A/D line is used to show market sentiment, as it tells traders whether there are more stocks rising or falling. It is used to confirm price trends in major indexes, and can also warn of reversals when divergence occurs.
The percentage of stocks trading above a specific moving average is a breadth indicator that measures internal strength or weakness in the underlying index. The 50-day moving average is used for short-to-medium-term timeframes, while the 150-day and 200-day moving averages are used for medium-to-long-term timeframes. Signals can be derived from overbought/oversold levels, crosses above/below 50% and bullish/bearish divergences.
The Dow Jones Industrial Average (DJIA), commonly known as “The Dow” is an index representing 30 stock of companies maintained and reviewed by the editors of the Wall Street Journal. The Russell 2000 Index measures the performance of the 2,000 smallest companies in the Russell 3000 Index, which represent approximately 8% of the total market capitalization of the Russell 3000 Index.
The S&P 500 is an unmanaged index of 500 widely held stocks that is generally considered representative of the U.S stock market. Past performance may not be indicative of future results. Keep in mind that individuals cannot invest directly in any index, and index performance does not include transaction costs or other fees, which will affect actual investment performance. Individual investors’ results will vary. Opinions expressed are those of the author John N. Lilly III, and not necessarily those of Raymond James. “There is no guarantee that these statements, opinions, or forecast provided herein will prove to be correct. “The information contained was received from sources believed to be reliable, but accuracy is not guaranteed. Investing always involves risk, and you may incur a profit or loss. No investment strategy can guarantee success. The charts and/or tables presented herein are for illustrative purposes only and should not be considered as the sole basis for your investment decision. International investing involves special risks, including currency fluctuations, different financial accounting standards, and possible political and economic volatility. Investing in emerging markets can be riskier than investing in well-established foreign markets.
This is not a recommendation to buy or sell any company’s stock mentioned above.
US government bonds and treasury bills are guaranteed by the US government and, if held to maturity, offer a fixed rate of return and guaranteed principal value. US government bonds are issued and guaranteed as to the timely payment of principal and interest by the federal government. Bond prices and yields are subject to change based upon market conditions and availability. If bonds are sold prior to maturity, you may receive more or less than your initial investment. Holding bonds to term allows redemption at par value. There is an inverse relationship between interest rate movements and bond prices. Generally, when interest rates rise, bond prices fall and when interest rates fall, bond prices generally rise.