


Morning Brief

Headline News:
The S&P 500 futures are down 8 points and are trading 0.3% below fair value. The Nasdaq 100 futures are down 15 points and are trading 0.3% below fair value. The Dow Jones Industrial Average futures are down 66 points and are trading 0.1% below fair value.
Yesterday’s sentiment-driven gains have been stymied by an early inclination to sell into strength.
The European Commission officially asked member states to cut their gas commission by 15% between August 1st and March 31st 2023. The 27 EU governments are asked to update their emergency plans and report to the Commission every two months on how they’re progressing to comply. Commission President Ursula von der Leyen said, “whether a partial major cut-off of Russian gas or a total cut-off of Russian gas, Europe needs to be ready.”
In other European news, bond markets got some relief ahead of a key ECB meeting Thursday when Italy’s Prime Minister Draghi said he will stay in power provided parliamentarians back his coalition government.
Inflation hit a 40-yr high of 9.4% in the UK, fueling fears that the Bank of England will have to be more aggressive. Bank of England Governor Bailey said policymakers will consider a 50 basis point rate hike at their meeting next month.
In other news, the mortgage demand dropped to a 22-yr low, with the MBA Mortgage Application Index showing a contraction of more than 6% week-over-week.
(Michael Gibbs, Director of Equity Portfolio & Technical Strategy)
Markets:
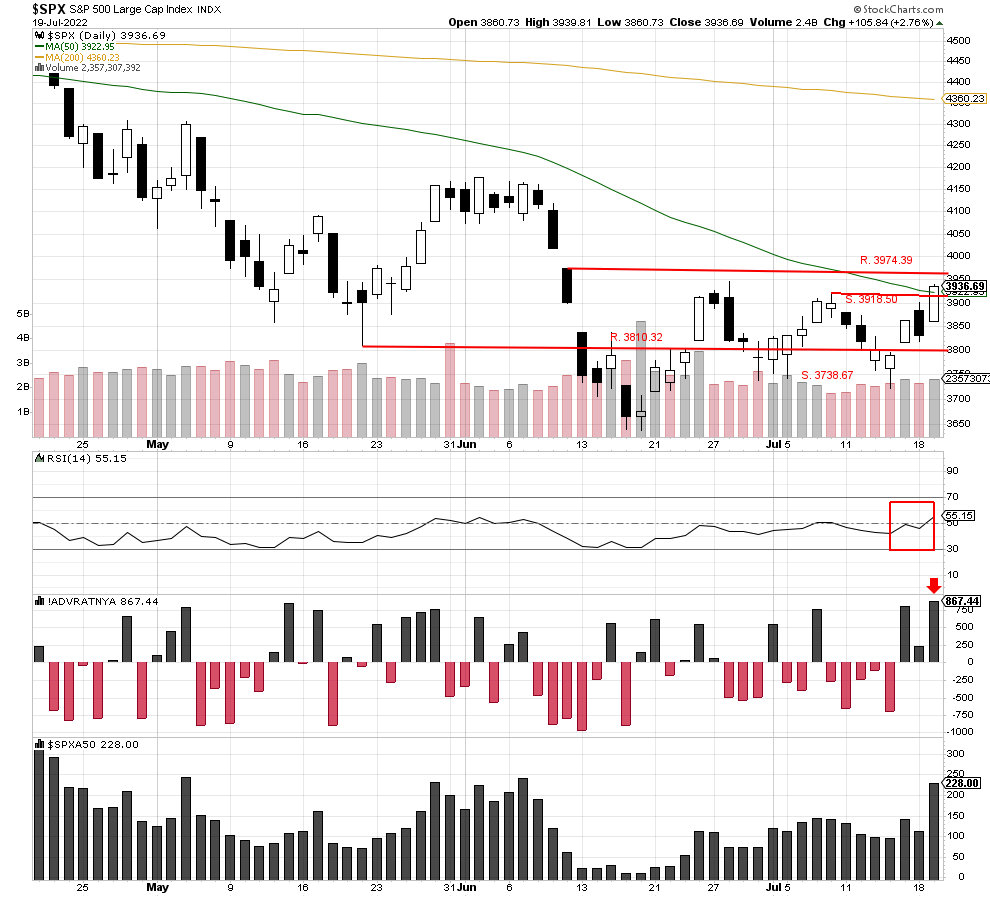
The S&P 500 powered past the 50-day moving average at 3922.95 and closed higher at 3936.69. The RSI index closed at 55.15 in support of the rally, and the Advance/Decline indicator also closed much higher. Upside volume accounted for 92.0% of the volume, which shows the uptrend is back for now.
The S&P 500 has rallied 5.8% since 7/14/2022, and some profit-taking would be expected at these levels today. Potential resistance is now at 3974.39, and possible support will be at the 50-day moving average at 3922.95.
We are currently Intermediate-term bearish and short-term bearish.
John N. Lilly III CPFA
Accredited Portfolio Management Advisor℠
Accredited Asset Management Specialist℠
Portfolio Manager, RJFS
Partner, DJWMG
Windsor Wealth Planners & Strategist
Futures trading is speculative, leveraged, and involves substantial risks. Investing always involves risk, including the loss of principal, and futures trading could present additional risk based on underlying commodities investments.
The Relative Strength Index (RSI), developed by J. Welles Wilder, is a momentum oscillator that measures the speed and changes of price movements.
The advance/decline line (A/D) is a technical indicator that plots the difference between the number of advancing and declining stocks on a daily basis. The indicator is cumulative, with a positive number being added to the prior number, or if the number is negative it is subtracted from the prior number.
The A/D line is used to show market sentiment, as it tells traders whether there are more stocks rising or falling. It is used to confirm price trends in major indexes, and can also warn of reversals when divergence occurs.
The percentage of stocks trading above a specific moving average is a breadth indicator that measures internal strength or weakness in the underlying index. The 50-day moving average is used for short-to-medium-term timeframes, while the 150-day and 200-day moving averages are used for medium-to-long-term timeframes. Signals can be derived from overbought/oversold levels, crosses above/below 50% and bullish/bearish divergences.
The Dow Jones Industrial Average (DJIA), commonly known as “The Dow” is an index representing 30 stock of companies maintained and reviewed by the editors of the Wall Street Journal. The Russell 2000 Index measures the performance of the 2,000 smallest companies in the Russell 3000 Index, which represent approximately 8% of the total market capitalization of the Russell 3000 Index.
The S&P 500 is an unmanaged index of 500 widely held stocks that is generally considered representative of the U.S stock market. Past performance may not be indicative of future results. Keep in mind that individuals cannot invest directly in any index, and index performance does not include transaction costs or other fees, which will affect actual investment performance. Individual investors’ results will vary. Opinions expressed are those of the author John N. Lilly III, and not necessarily those of Raymond James. “There is no guarantee that these statements, opinions, or forecast provided herein will prove to be correct. “The information contained was received from sources believed to be reliable, but accuracy is not guaranteed. Investing always involves risk, and you may incur a profit or loss. No investment strategy can guarantee success. The charts and/or tables presented herein are for illustrative purposes only and should not be considered as the sole basis for your investment decision. International investing involves special risks, including currency fluctuations, different financial accounting standards, and possible political and economic volatility. Investing in emerging markets can be riskier than investing in well-established foreign markets.
This is not a recommendation to buy or sell any company’s stock mentioned above.
US government bonds and treasury bills are guaranteed by the US government and, if held to maturity, offer a fixed rate of return and guaranteed principal value. US government bonds are issued and guaranteed as to the timely payment of principal and interest by the federal government. Bond prices and yields are subject to change based upon market conditions and availability. If bonds are sold prior to maturity, you may receive more or less than your initial investment. Holding bonds to term allows redemption at par value. There is an inverse relationship between interest rate movements and bond prices. Generally, when interest rates rise, bond prices fall and when interest rates fall, bond prices generally rise.