


Morning Brief

Headline News:
The S&P 500 futures are down 94 points and are trading 2.4% below fair value. The Nasdaq 100 futures are down 370 points and are trading 3.3% below fair value. The Dow Jones Industrial Average futures are down 612 points and are trading 1.8% below fair value.
The stock market is set for a sharply lower open with follow-through selling from Friday’s CPI-induced selloff. Worries about the Fed taking an even more aggressive rate-hike path have undercut risk sentiment along with a massive selloff in cryptocurrency markets, reports of renewed lockdowns in Shanghai and Beijing, and a brief inversion of the 2s10s spread overnight.
It all centers around growth concerns, however, which feed directly into concerns about earnings estimates being subject to large downward revisions.
Foreign markets have traded lower in the wake of Wall Street’s weakness and amid their own growth concerns.
Bitcoin is currently down 13.9% to $23,642.00, feeling the added pressure of crypto lender Celsius announcing that it is pausing all customer withdrawals and transfers due to “extreme market conditions.”
The 2-yr note yield is up 18 bps to 3.22%. The 10-yr note yield is up 11 bps to 3.27%. The U.S. Dollar Index is up 0.7% to 104.82. WTI crude futures are down 1.6% to $118.70/bbl.
(Michael Gibbs, Director of Equity Portfolio & Technical Strategy)
Markets:
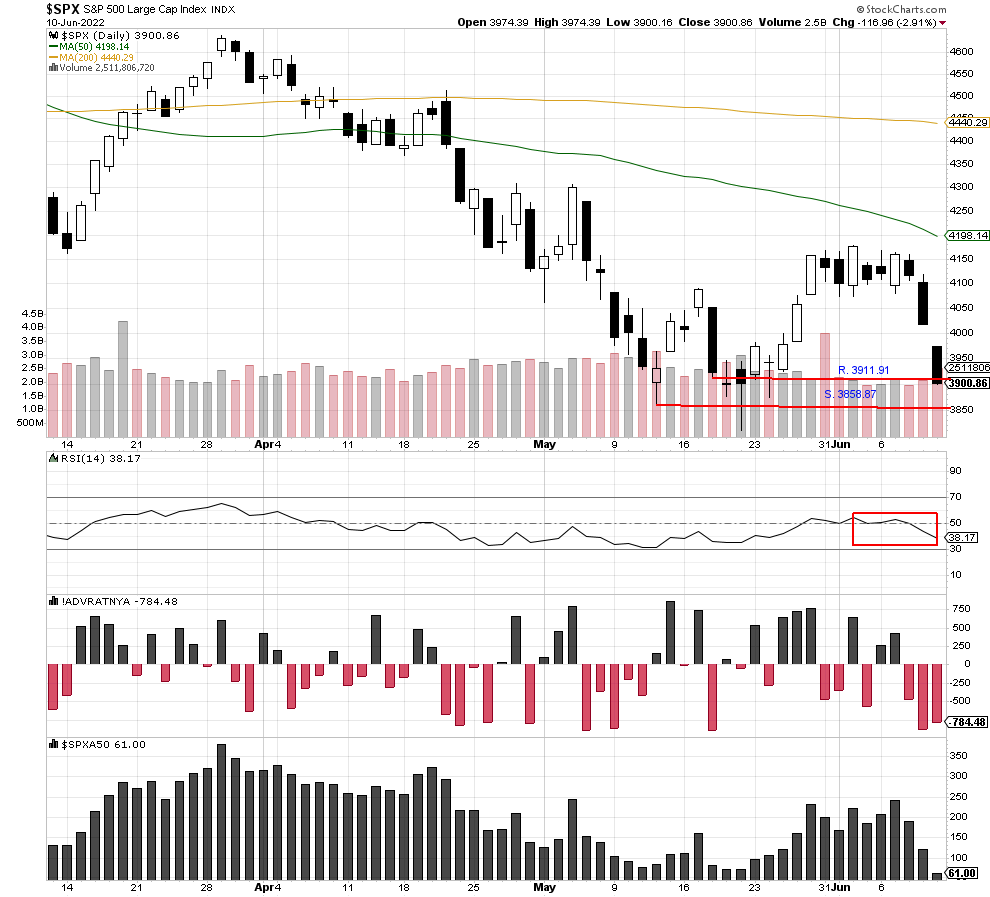
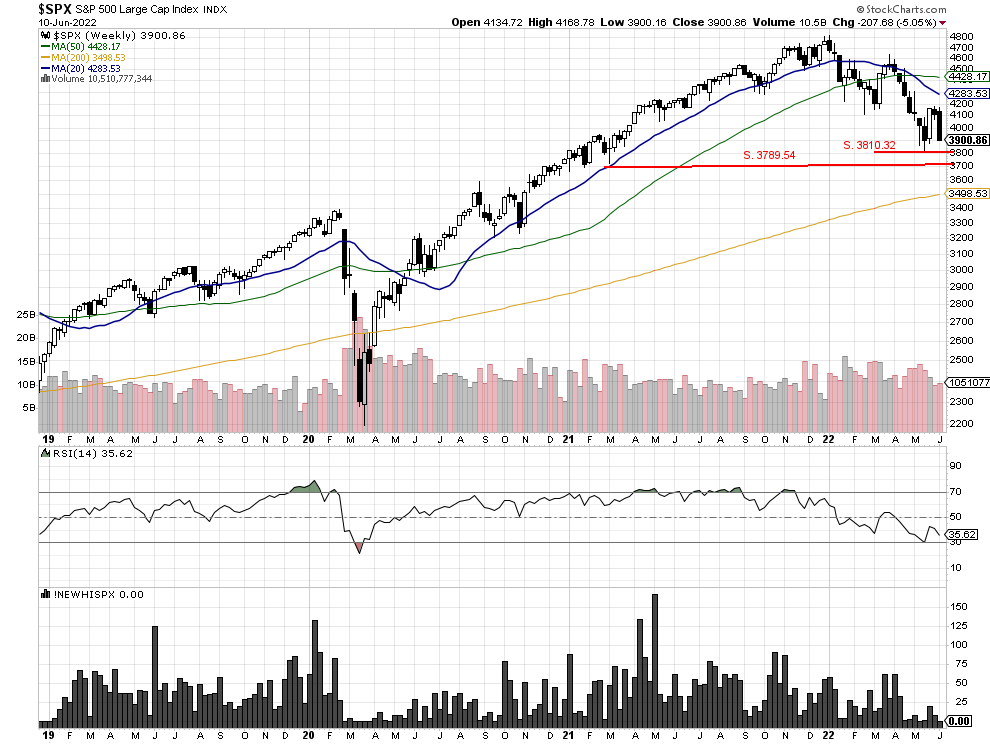
The S&P 500 sold off on Friday, closing at 3900.86 and below support at 3911.91. So far this morning, the index is set to open 2% lower at 3811.30 and potentially establish a new low for the year. If so, the index will take out the Fibonacci retracement level at 3811.00 and make the next possible support level 3789.54. We feel this level can potentially hold today, and buyers might step in to support the index.
We are currently Intermediate-term bearish and short-term bearish.
John N. Lilly III CPFA
Accredited Portfolio Management Advisor℠
Accredited Asset Management Specialist℠
Portfolio Manager, RJFS
Partner, DJWMG
Windsor Wealth Planners & Strategist
Futures trading is speculative, leveraged, and involves substantial risks. Investing always involves risk, including the loss of principal, and futures trading could present additional risk based on underlying commodities investments.
The Relative Strength Index (RSI), developed by J. Welles Wilder, is a momentum oscillator that measures the speed and changes of price movements.
The advance/decline line (A/D) is a technical indicator that plots the difference between the number of advancing and declining stocks on a daily basis. The indicator is cumulative, with a positive number being added to the prior number, or if the number is negative it is subtracted from the prior number.
The A/D line is used to show market sentiment, as it tells traders whether there are more stocks rising or falling. It is used to confirm price trends in major indexes, and can also warn of reversals when divergence occurs.
The percentage of stocks trading above a specific moving average is a breadth indicator that measures internal strength or weakness in the underlying index. The 50-day moving average is used for short-to-medium-term timeframes, while the 150-day and 200-day moving averages are used for medium-to-long-term timeframes. Signals can be derived from overbought/oversold levels, crosses above/below 50% and bullish/bearish divergences.
The Dow Jones Industrial Average (DJIA), commonly known as “The Dow” is an index representing 30 stock of companies maintained and reviewed by the editors of the Wall Street Journal. The Russell 2000 Index measures the performance of the 2,000 smallest companies in the Russell 3000 Index, which represent approximately 8% of the total market capitalization of the Russell 3000 Index.
The S&P 500 is an unmanaged index of 500 widely held stocks that is generally considered representative of the U.S stock market. Past performance may not be indicative of future results. Keep in mind that individuals cannot invest directly in any index, and index performance does not include transaction costs or other fees, which will affect actual investment performance. Individual investors’ results will vary. Opinions expressed are those of the author John N. Lilly III, and not necessarily those of Raymond James. “There is no guarantee that these statements, opinions, or forecast provided herein will prove to be correct. “The information contained was received from sources believed to be reliable, but accuracy is not guaranteed. Investing always involves risk, and you may incur a profit or loss. No investment strategy can guarantee success. The charts and/or tables presented herein are for illustrative purposes only and should not be considered as the sole basis for your investment decision. International investing involves special risks, including currency fluctuations, different financial accounting standards, and possible political and economic volatility. Investing in emerging markets can be riskier than investing in well-established foreign markets.
This is not a recommendation to buy or sell any company’s stock mentioned above.
US government bonds and treasury bills are guaranteed by the US government and, if held to maturity, offer a fixed rate of return and guaranteed principal value. US government bonds are issued and guaranteed as to the timely payment of principal and interest by the federal government. Bond prices and yields are subject to change based upon market conditions and availability. If bonds are sold prior to maturity, you may receive more or less than your initial investment. Holding bonds to term allows redemption at par value. There is an inverse relationship between interest rate movements and bond prices. Generally, when interest rates rise, bond prices fall and when interest rates fall, bond prices generally rise.
Fibonacci retracement levels—stemming from the Fibonacci sequence—are horizontal lines that indicate where support and resistance are likely to occur.
Each level is associated with a percentage. The percentage is how much of a prior move the price has retraced. The Fibonacci retracement levels are 23.6%, 38.2%, 61.8%, and 78.6%. While not officially a Fibonacci ratio, 50% is also used.
The indicator is useful because it can be drawn between any two significant price points, such as a high and a low. The indicator will then create the levels between those two points.