


Morning Brief

Headline News:
The S&P 500 futures are up 11 points and are trading 0.3% above fair value. The Nasdaq 100 futures are up 27 points and are trading 0.2% above fair value. The Dow Jones Industrial Average futures are up 64 points and are trading 0.2% above fair value.
The positive bias comes on the heels of yesterday’s losses, which continued a roller-coaster week of trading action. Accordingly, today is a bit more of that roller-coaster action in a range-bound market ahead of tomorrow’s CPI report.
A UBS upgrade of Tesla (TSLA) has been an instrumental support factor this morning. Some better-than-expected May trade data out of China has also been comforting; however, reports today that a southwest neighborhood in Shanghai has been locked down for COVID testing, and that entertainment venues in a Beijing district have been closed, have acted as mitigating factors.
On a related note, there was a Bloomberg report that said Chinese regulators may be considering allowing the Ant Group IPO to move forward. Chinese regulators, according to CNBC, have denied that report, so a number of Chinese ADRs have seen a reversal into negative territory on the denial.
A short time ago, the ECB announced that it decided to leave its key interest rates unchanged at today’s meeting, but the accompanying statement said the Governing Council intends to raise the ECB interest rates by 25 basis points at the July meeting and to end the net asset purchase program as of July 1.
The 10-yr note yield is up two basis points to 3.05%. The U.S Dollar Index is flat at 102.55. WTI crude futures are down 0.2% to $121.83/bbl.
(Michael Gibbs, Director of Equity Portfolio & Technical Strategy)
Markets:
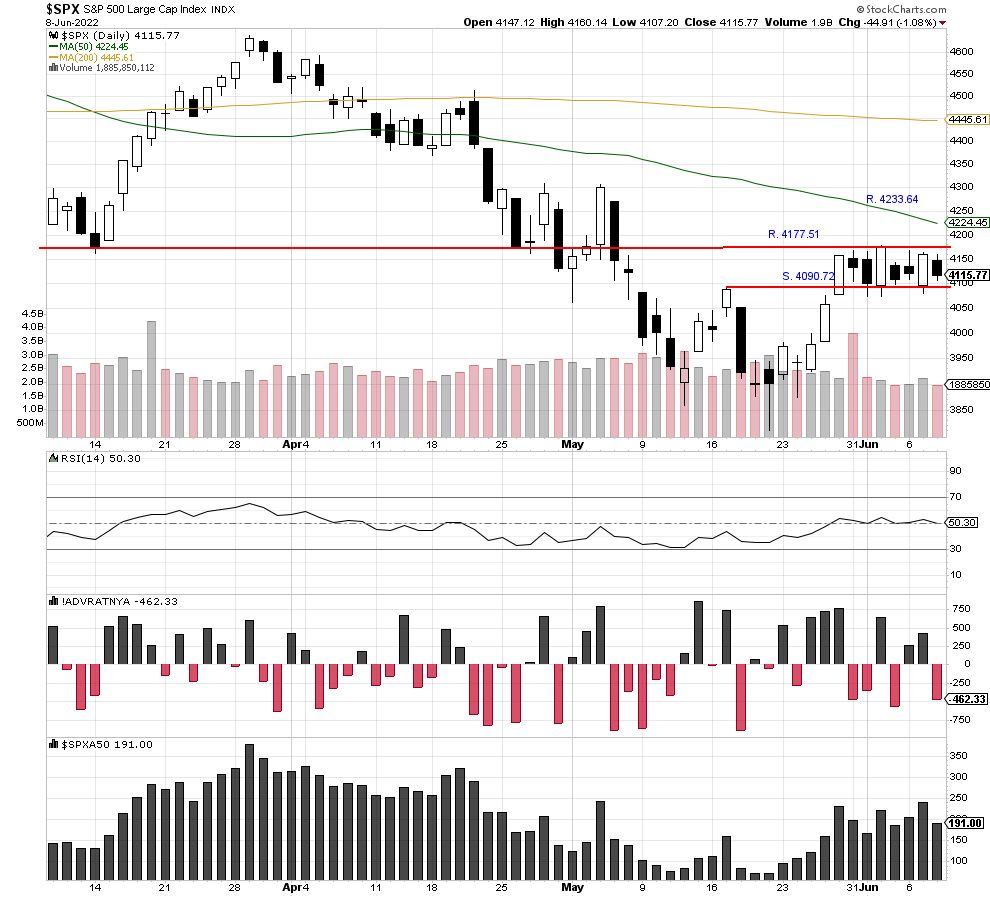
The S&P 500 closed lower at 4115.77 and remained in the current trading range of 4090.72-4177.51. The index is also still overbought despite the formation of an eight-day base. We feel traders have been biding their time until Friday’s release of the May inflation number, and the low volume of the last six trading days shows low participation. Today could be more of the same, and we feel the index will potentially close inside the trading range once again.
We are currently Intermediate-term bearish and short-term bearish.
John N. Lilly III CPFA
Accredited Portfolio Management Advisor℠
Accredited Asset Management Specialist℠
Portfolio Manager, RJFS
Partner, DJWMG
Windsor Wealth Planners & Strategist
Futures trading is speculative, leveraged, and involves substantial risks. Investing always involves risk, including the loss of principal, and futures trading could present additional risk based on underlying commodities investments.
The Relative Strength Index (RSI), developed by J. Welles Wilder, is a momentum oscillator that measures the speed and changes of price movements.
The advance/decline line (A/D) is a technical indicator that plots the difference between the number of advancing and declining stocks on a daily basis. The indicator is cumulative, with a positive number being added to the prior number, or if the number is negative it is subtracted from the prior number.
The A/D line is used to show market sentiment, as it tells traders whether there are more stocks rising or falling. It is used to confirm price trends in major indexes, and can also warn of reversals when divergence occurs.
The percentage of stocks trading above a specific moving average is a breadth indicator that measures internal strength or weakness in the underlying index. The 50-day moving average is used for short-to-medium-term timeframes, while the 150-day and 200-day moving averages are used for medium-to-long-term timeframes. Signals can be derived from overbought/oversold levels, crosses above/below 50% and bullish/bearish divergences.
The Dow Jones Industrial Average (DJIA), commonly known as “The Dow” is an index representing 30 stock of companies maintained and reviewed by the editors of the Wall Street Journal. The Russell 2000 Index measures the performance of the 2,000 smallest companies in the Russell 3000 Index, which represent approximately 8% of the total market capitalization of the Russell 3000 Index.
The S&P 500 is an unmanaged index of 500 widely held stocks that is generally considered representative of the U.S stock market. Past performance may not be indicative of future results. Keep in mind that individuals cannot invest directly in any index, and index performance does not include transaction costs or other fees, which will affect actual investment performance. Individual investors’ results will vary. Opinions expressed are those of the author John N. Lilly III, and not necessarily those of Raymond James. “There is no guarantee that these statements, opinions, or forecast provided herein will prove to be correct. “The information contained was received from sources believed to be reliable, but accuracy is not guaranteed. Investing always involves risk, and you may incur a profit or loss. No investment strategy can guarantee success. The charts and/or tables presented herein are for illustrative purposes only and should not be considered as the sole basis for your investment decision. International investing involves special risks, including currency fluctuations, different financial accounting standards, and possible political and economic volatility. Investing in emerging markets can be riskier than investing in well-established foreign markets.
This is not a recommendation to buy or sell any company’s stock mentioned above.
US government bonds and treasury bills are guaranteed by the US government and, if held to maturity, offer a fixed rate of return and guaranteed principal value. US government bonds are issued and guaranteed as to the timely payment of principal and interest by the federal government. Bond prices and yields are subject to change based upon market conditions and availability. If bonds are sold prior to maturity, you may receive more or less than your initial investment. Holding bonds to term allows redemption at par value. There is an inverse relationship between interest rate movements and bond prices. Generally, when interest rates rise, bond prices fall and when interest rates fall, bond prices generally rise.