


Morning Brief
![]()
Headline News:
Wall Street is set for a sell-off when the market opens after rising oil prices brought on fears of higher inflation. The 10-year yield traded at the highest yield since June, and that has investors selling mega-tech companies again this morning. A rise in inflation could force the Federal Reserve to begin a bond tapering policy sooner than expected. However, this morning the ADP U.S private payrolls increased by 568,000 jobs last month, which was more than expected, showing the U.S. economy is continuing to reopen.
Markets:
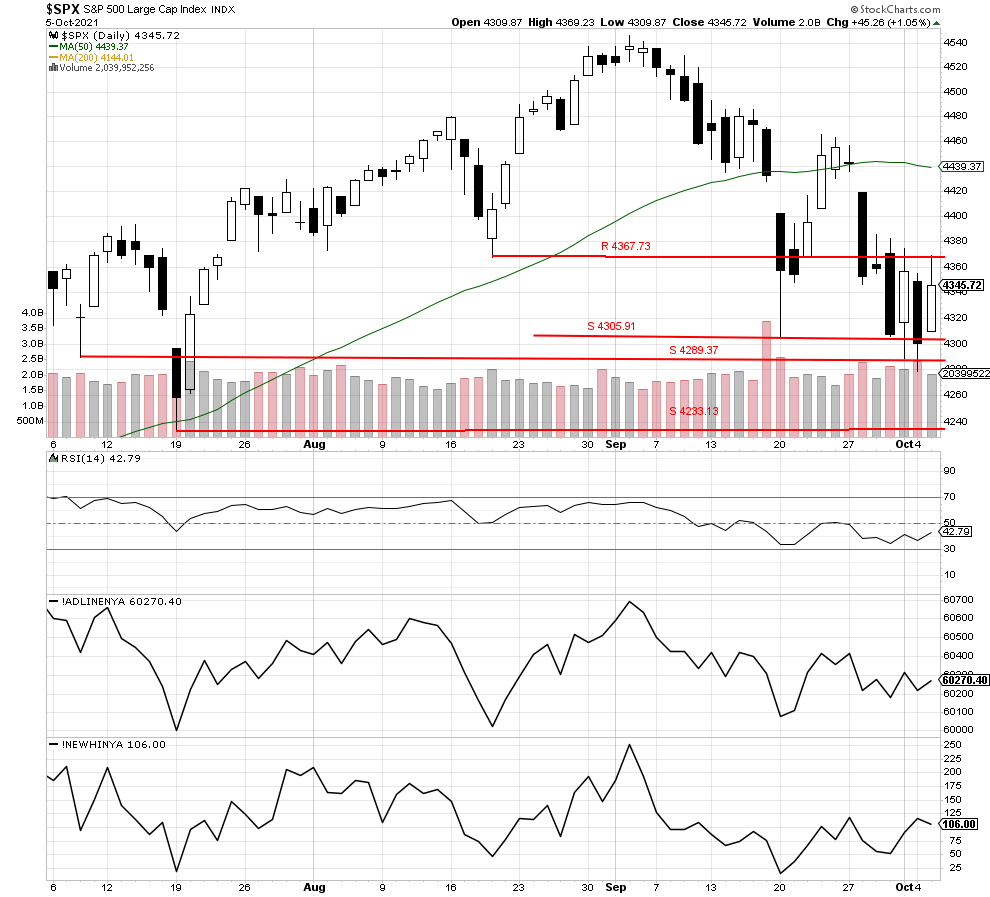
The S&P 500 rallied up to resistance at 4367.73 but sold off late to close higher at 4345.72. It appears this was only a snapback rally because the index is set to open below 4300 this morning. So, the potential support level at 4289.37 becomes critical and needs to hold again in today’s trading. We feel the index will test that level again today, and we are hoping for buyers to set up in a stage a late-day rally. If that level does not hold, then the next level of possible support becomes 4233.13.
We are currently Intermediate-term bullish and short-term bearish.
John N. Lilly III CPFA
Accredited Portfolio Management Advisor℠
Accredited Asset Management Specialist℠
Portfolio Manager, RJFS
Partner, DJWMG
Windsor Wealth Planners & Strategist
Futures trading is speculative, leveraged, and involves substantial risks. Investing always involves risk, including the loss of principal, and futures trading could present additional risk based on underlying commodities investments.
The Relative Strength Index (RSI), developed by J. Welles Wilder, is a momentum oscillator that measures the speed and changes of price movements.
The advance/decline line (A/D) is a technical indicator that plots the difference between the number of advancing and declining stocks on a daily basis. The indicator is cumulative, with a positive number being added to the prior number, or if the number is negative it is subtracted from the prior number.
The A/D line is used to show market sentiment, as it tells traders whether there are more stocks rising or falling. It is used to confirm price trends in major indexes, and can also warn of reversals when divergence occurs.
Net New 52-Week Highs is a simple breadth indicator found by subtracting new lows from new highs. “New lows” is the number of stocks recording new 52-week lows. “New highs” is the number of stocks making new 52-week highs. This indicator provides an immediate score for internal strength or weakness in the market. There are more new highs when the indicator is positive, which favors the bulls. There are more new lows when the indicator is negative, which favors the bears. Chartists can analyze daily fluctuations or apply a moving average to create an oscillator that meanders above and below the zero line. Net New Highs can also be used like the AD Line by creating a High-Low Line based on cumulative Net New Highs.
The S&P 500 is an unmanaged index of 500 widely held stocks that is generally considered representative of the U.S stock market. Past performance may not be indicative of future results. Keep in mind that individuals cannot invest directly in any index, and index performance does not include transaction costs or other fees, which will affect actual investment performance. Individual investors’ results will vary. Opinions expressed are those of the author John N. Lilly III, and not necessarily those of Raymond James. “There is no guarantee that these statements, opinions, or forecast provided herein will prove to be correct. “The information contained was received from sources believed to be reliable, but accuracy is not guaranteed. Investing always involves risk, and you may incur a profit or loss. No investment strategy can guarantee success. The charts and/or tables presented herein are for illustrative purposes only and should not be considered as the sole basis for your investment decision. International investing involves special risks, including currency fluctuations, different financial accounting standards, and possible political and economic volatility.