



Morning Brief

Headline News:
Equity futures point to a sharply lower opening this morning as an escalation in hostilities between the U.S. and Iran sends oil prices surging and puts broad pressure on stocks.
Oil-driven volatility played a role in yesterday’s lower finish for the major averages, with President Trump revoking the waiver that allowed Iran to sell oil after Iran struck several commercial ships in the Strait of Hormuz. Tensions escalated further overnight, with President Trump declaring the ceasefire over and Axios reporting that fresh U.S. strikes on Iran were four or five times bigger in scope than previous strikes. WTI crude oil is currently up $3.60 (+5.1%) to $74.04 per barrel.
Elsewhere, semiconductor stocks are on track for another lower opening, with concentrated pressure across the group weighing on the major averages yesterday. Memory names are among the worst performers in the premarket.
Today will be lighter on the data side, though the market will receive the minutes for the June FOMC meeting at 2:00 p.m. ET, the first with new Fed Chair Kevin Warsh at the helm.
(Michael Gibbs, Managing Director, Lead Portfolio Manager)
Markets:
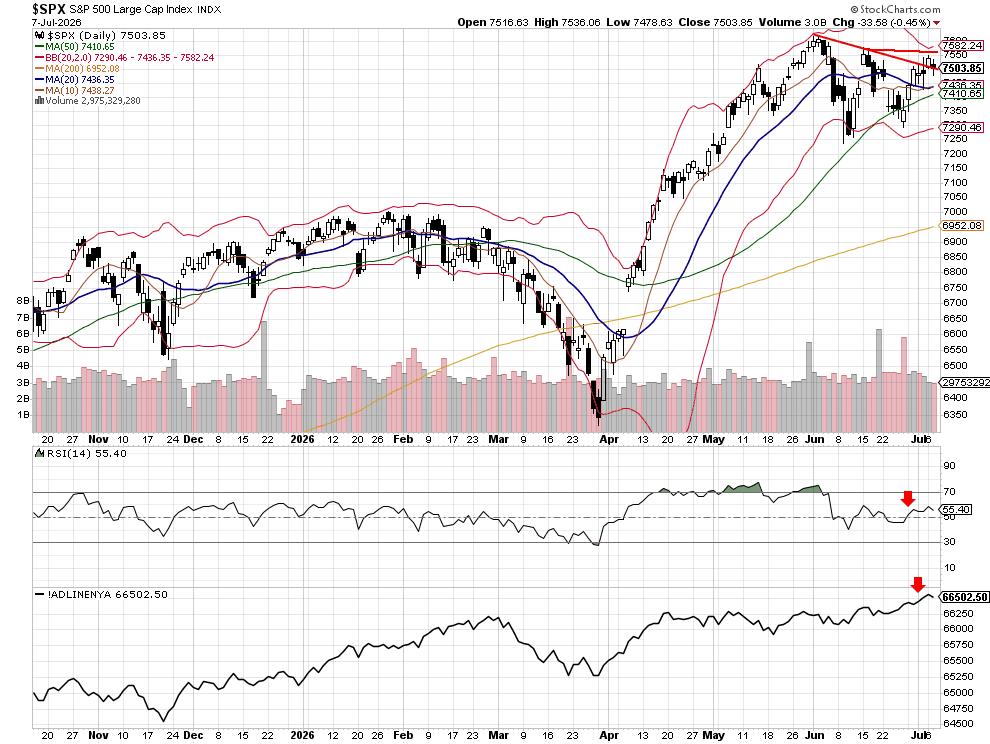
The S&P 500 traded sideways in a tight range, closing slightly lower at 7,503.85. The RSI index moved lower alongside the Advance/Decline line, indicating a weakening in market breadth. The index is currently sitting on the downtrend line, but that potential support level is likely to be breached at the open due to renewed concerns surrounding the Iran conflict.
If selling pressure continues, the next potential support levels are the 10-day moving average at 7,438.27 and the 20-day moving average at 7,436.28. When two key support levels converge, there is a higher likelihood that buyers may step in, and we feel that could happen today if those levels are tested.
Additionally, if selling intensifies, President Trump could announce a ceasefire to reassure equity markets and calm investor concerns.
John N. Lilly III CPFA
Accredited Portfolio Management Advisor℠
Accredited Asset Management Specialist℠
Portfolio Manager, RJFS
Partner, DJWMG
Windsor Wealth Planners & Strategists
Futures trading is speculative, leveraged, and involves substantial risks. Investing always involves risk, including the loss of principal, and futures trading could present additional risk due to underlying commodity investments.
The Relative Strength Index (RSI), developed by J. Welles Wilder, is a momentum oscillator that measures the speed and changes of price movements.
The percentage of stocks trading above a specific moving average is a breadth indicator that measures the underlying index’s internal strength or weakness. The 50-day moving average is used for short- to medium-term timeframes, while the 150-day and 200-day moving averages are used for medium- to long-term timeframes. Signals can be derived from overbought/oversold levels, crosses above/below 50%, and bullish/bearish divergences.
The Dow Jones Industrial Average (DJIA), commonly known as “The Dow,” is an index representing 30 stocks of companies maintained and reviewed by the editors of the Wall Street Journal. The Russell 2000 Index measures the performance of the 2,000 smallest companies in the Russell 3000 Index, which represents approximately 8% of the Russell 3000 Index’s total market capitalization.
The S&P 500 is an unmanaged index of 500 widely held stocks that is generally considered representative of the U.S. stock market. Past performance may not be indicative of future results. Keep in mind that individuals cannot invest directly in any index, and index performance does not include transaction costs or other fees, which will affect actual investment performance. Individual investors’ results will vary. Opinions expressed are those of the author, John N. Lilly III, and not necessarily those of Raymond James. “There is no guarantee that these statements, opinions, or forecast provided herein will prove to be correct. “The information contained was received from sources believed to be reliable, but accuracy is not guaranteed. Investing always involves risk, and you may incur a profit or loss. No investment strategy can guarantee success. The charts and/or tables presented herein are for illustrative purposes only and should not be considered as the sole basis for your investment decision. International investing involves special risks, including currency fluctuations, different financial accounting standards, and possible political and economic volatility. Investing in emerging markets can be riskier than investing in well-established foreign markets.
This is not a recommendation to buy or sell any company’s stock mentioned above.
US government bonds and treasury bills are guaranteed by the US government and, if held to maturity, offer a fixed rate of return and guaranteed principal value. US government bonds are issued and guaranteed by the federal government’s timely payment of principal and interest. Bond prices and yields are subject to change based on market conditions and availability. If bonds are sold prior to maturity, you may receive more or less than your initial investment. Holding bonds to term allows redemption at par value. There is an inverse relationship between interest rate movements and bond prices. Generally, when interest rates rise, bond prices fall, and when interest rates fall, bond prices generally rise.
The Nasdaq 100 (^NDX) is a stock market index comprising 103 equity securities of 100 of the largest non-financial companies listed on the NASDAQ. It is a modified capitalization-weighted index. It is based on exchange and not an index of U.S.-based companies.
The Russell 2000 Index is a stock market index that measures the performance of the 2,000 smaller companies included in the Russell 3000 Index. It is managed by London’s FTSE Russell Group and is widely regarded as a bellwether of the U.S. economy because it tracks smaller companies that operate in the U.S. market.
The NYSE advance/decline measure refers to the number of common stocks listed on the New York Stock Exchange (NYSE) that close at a higher price than their previous closing price (“advancing issues”) compared to the number of NYSE-listed common stocks that close at a lower price than their previous closing price (“declining issues”) during a specified trading session.
This measure serves as an indicator of market breadth and reflects the extent to which price movements are broadly distributed across NYSE-listed securities.