


Morning Brief.

Headline News:
Equity futures point to a flattish opening this morning as investors monitor mostly optimistic updates on negotiations between the U.S. and Iran coming off the long holiday weekend. The two sides signed a 60-day memorandum of understanding last week, pushing oil prices sharply lower and helping the major averages recover from a post-FOMC meeting sell-off to finish higher for the week.
The FOMC kept rates unchanged but struck a hawkish tone, which bumped up market expectations and the timeline for a rate hike. Inflation readings will come fully into focus later in the week with Thursday’s release of the May Personal Income and Spending Report, which includes the PCE Price Index (Briefing.com consensus 0.4%), the Fed’s preferred inflation gauge.
Meanwhile, economic data is on the lighter side today. Earnings will also be lighter throughout the week, with just a handful of S&P 500 names set to report.
(Michael Gibbs, Managing Director, Lead Portfolio Manager)
Markets:
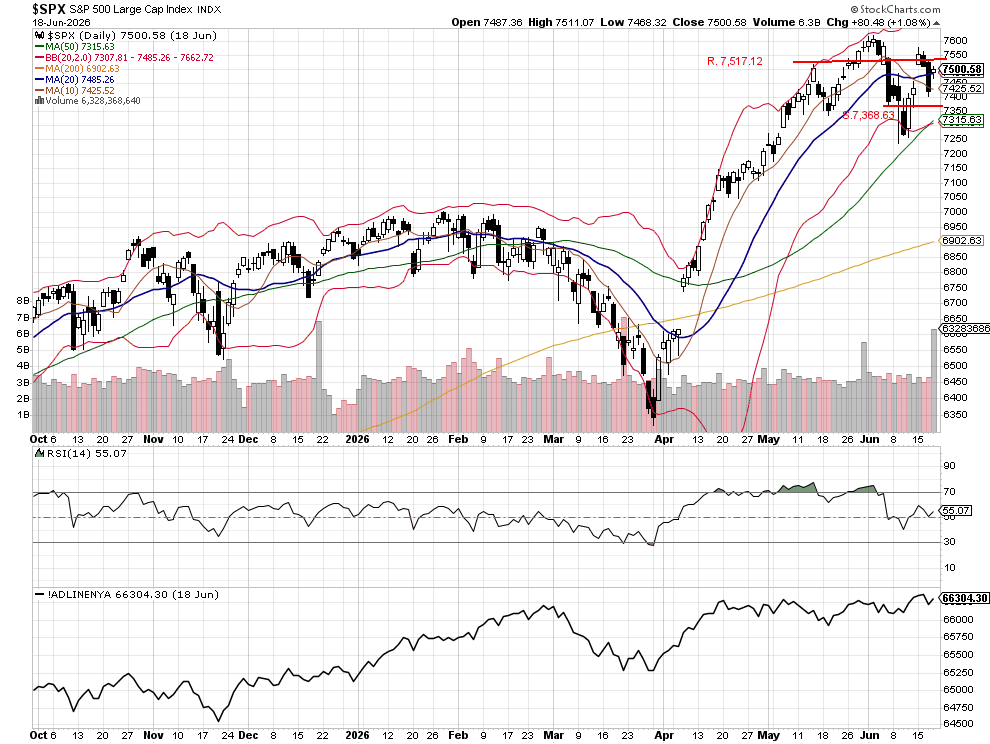
The S&P 500 traded in a relatively tight range on Monday, closing modestly higher at 7,500.58. More importantly, the index managed to finish back above its 20-day moving average at 7,485.26, recovering from the heavy selling pressure seen in the prior session.
This morning, S&P 500 futures are little changed, offering few clues about the market’s direction at the open. While the ability to reclaim the 20-day moving average is a constructive sign, the index must continue to hold above that level to confirm that buyers have regained control.
The next key hurdle is the potential resistance level at 7,517.12. A decisive close above that level would suggest the recent selloff was merely a short-term setback and could open the door for a retest of higher levels. However, failure to break through resistance may lead to further consolidation as investors continue to assess the market’s near-term outlook.
John N. Lilly III CPFA
Accredited Portfolio Management Advisor℠
Accredited Asset Management Specialist℠
Portfolio Manager, RJFS
Partner, DJWMG
Windsor Wealth Planners & Strategists
Futures trading is speculative, leveraged, and involves substantial risks. Investing always involves risk, including the loss of principal, and futures trading could present additional risk due to underlying commodity investments.
The Relative Strength Index (RSI), developed by J. Welles Wilder, is a momentum oscillator that measures the speed and changes of price movements.
The percentage of stocks trading above a specific moving average is a breadth indicator that measures the underlying index’s internal strength or weakness. The 50-day moving average is used for short- to medium-term timeframes, while the 150-day and 200-day moving averages are used for medium- to long-term timeframes. Signals can be derived from overbought/oversold levels, crosses above/below 50%, and bullish/bearish divergences.
The Dow Jones Industrial Average (DJIA), commonly known as “The Dow,” is an index representing 30 stocks of companies maintained and reviewed by the editors of the Wall Street Journal. The Russell 2000 Index measures the performance of the 2,000 smallest companies in the Russell 3000 Index, which represents approximately 8% of the Russell 3000 Index’s total market capitalization.
The S&P 500 is an unmanaged index of 500 widely held stocks that is generally considered representative of the U.S. stock market. Past performance may not be indicative of future results. Keep in mind that individuals cannot invest directly in any index, and index performance does not include transaction costs or other fees, which will affect actual investment performance. Individual investors’ results will vary. Opinions expressed are those of the author, John N. Lilly III, and not necessarily those of Raymond James. “There is no guarantee that these statements, opinions, or forecast provided herein will prove to be correct. “The information contained was received from sources believed to be reliable, but accuracy is not guaranteed. Investing always involves risk, and you may incur a profit or loss. No investment strategy can guarantee success. The charts and/or tables presented herein are for illustrative purposes only and should not be considered as the sole basis for your investment decision. International investing involves special risks, including currency fluctuations, different financial accounting standards, and possible political and economic volatility. Investing in emerging markets can be riskier than investing in well-established foreign markets.
This is not a recommendation to buy or sell any company’s stock mentioned above.
US government bonds and treasury bills are guaranteed by the US government and, if held to maturity, offer a fixed rate of return and guaranteed principal value. US government bonds are issued and guaranteed by the federal government’s timely payment of principal and interest. Bond prices and yields are subject to change based on market conditions and availability. If bonds are sold prior to maturity, you may receive more or less than your initial investment. Holding bonds to term allows redemption at par value. There is an inverse relationship between interest rate movements and bond prices. Generally, when interest rates rise, bond prices fall, and when interest rates fall, bond prices generally rise.
The Nasdaq 100 (^NDX) is a stock market index comprising 103 equity securities of 100 of the largest non-financial companies listed on the NASDAQ. It is a modified capitalization-weighted index. It is based on exchange and not an index of U.S.-based companies.
The Russell 2000 Index is a stock market index that measures the performance of the 2,000 smaller companies included in the Russell 3000 Index. It is managed by London’s FTSE Russell Group and is widely regarded as a bellwether of the U.S. economy because it tracks smaller companies that operate in the U.S. market.
The NYSE advance/decline measure refers to the number of common stocks listed on the New York Stock Exchange (NYSE) that close at a higher price than their previous closing price (“advancing issues”) compared to the number of NYSE-listed common stocks that close at a lower price than their previous closing price (“declining issues”) during a specified trading session.
This measure serves as an indicator of market breadth and reflects the extent to which price movements are broadly distributed across NYSE-listed securities.