


Morning Brief

Headline News:
Equity futures point to a higher opening this morning as investors assess a hefty batch of earnings reports and monitor developments on the geopolitical front.
The major averages finished mostly lower yesterday, snapping a 13-session winning streak for the Nasdaq Composite as tech and mega-cap names took a modest step back after an impressive rally. The broader market, however, fared relatively well, and the S&P 500 Equal Weighted Index finished with a modest gain.
Oil prices are flattish this morning after a bounce yesterday as the state of U.S.-Iran negotiations remains tenuous, with Vice President JD Vance set to travel to Pakistan for the next round of talks.
While the market will still react to geopolitical swings, the recovery of all losses since the start of the Iran war suggests investors are largely looking past the conflict, as a ceasefire seems the most feasible option for all parties involved. Attention now shifts to earnings season, where solid results and steady guidance from several Dow components reporting today are helping maintain growth projections and reinforce the view that earnings momentum is continuing to build.
On the macro front, the Senate will hold a confirmation hearing for Fed Chairman Kevin Warsh this morning, according to CBS News.
(Michael Gibbs, Managing Director, Lead Portfolio Manager |)
Markets:
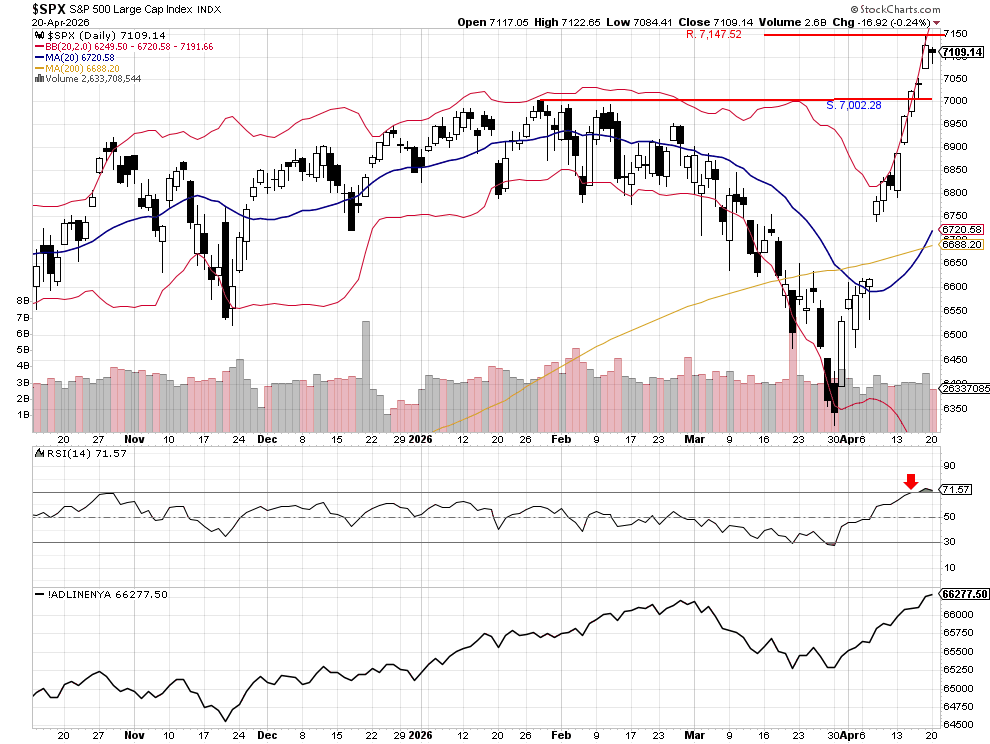
The S&P 500 closed lower at 7,109.14, while the RSI moved further into overbought territory, ending the day at 71.57. The index traded within the prior session’s range, forming an inside day. This type of price action is common in overbought markets and often suggests that recent buying momentum is beginning to slow. As a result, today’s trading could be relatively muted.
However, the U.S. Retail Sales report came in better than expected, and S&P 500 futures are higher by 0.30% this morning. There is potential support at the recent all-time high of 7,147.52, and we believe that level should hold if tested today.
John N. Lilly III CPFA
Accredited Portfolio Management Advisor℠
Accredited Asset Management Specialist℠
Portfolio Manager, RJFS
Partner, DJWMG
Windsor Wealth Planners & Strategists
Futures trading is speculative, leveraged, and involves substantial risks. Investing always involves risk, including the loss of principal, and futures trading could present additional risk based on underlying commodities investments.
The Relative Strength Index (RSI), developed by J. Welles Wilder, is a momentum oscillator that measures the speed and changes of price movements.
The percentage of stocks trading above a specific moving average is a breadth indicator that measures internal strength or weakness in the underlying index. The 50-day moving averages are used for short-to-medium-term timeframes, while the 150-day and 200-day moving averages are used for medium-to-long-term ones. Signals can be derived from overbought/oversold levels, crosses above/below 50%, and bullish/bearish divergences.
The Dow Jones Industrial Average (DJIA), commonly known as “The Dow,” is an index representing 30 stocks of companies maintained and reviewed by the editors of the Wall Street Journal. The Russell 2000 Index measures the performance of the 2,000 smallest companies in the Russell 3000 Index, which represents approximately 8% of the total market capitalization of the Russell 3000 Index.
The S&P 500 is an unmanaged index of 500 widely held stocks that is generally considered representative of the U.S. stock market. Past performance may not be indicative of future results. Keep in mind that individuals cannot invest directly in any index, and index performance does not include transaction costs or other fees, which will affect actual investment performance. Individual investors’ results will vary. Opinions expressed are those of the author, John N. Lilly III, and not necessarily those of Raymond James. “There is no guarantee that these statements, opinions, or forecast provided herein will prove to be correct. “The information contained was received from sources believed to be reliable, but accuracy is not guaranteed. Investing always involves risk, and you may incur a profit or loss. No investment strategy can guarantee success. The charts and/or tables presented herein are for illustrative purposes only and should not be considered as the sole basis for your investment decision. International investing involves special risks, including currency fluctuations, different financial accounting standards, and possible political and economic volatility. Investing in emerging markets can be riskier than investing in well-established foreign markets.
This is not a recommendation to buy or sell any company’s stock mentioned above.
US government bonds and treasury bills are guaranteed by the US government and, if held to maturity, offer a fixed rate of return and guaranteed principal value. US government bonds are issued and guaranteed due to the federal government’s timely principal and interest payment. Bond prices and yields are subject to change based on market conditions and availability. If bonds are sold prior to maturity, you may receive more or less than your initial investment. Holding bonds to term allows redemption at par value. There is an inverse relationship between interest rate movements and bond prices. Generally, when interest rates rise, bond prices fall, and when interest rates fall, bond prices generally rise.
The Nasdaq 100 (^NDX) is a stock market index made up of 103 equity securities issued by 100 of the largest non-financial companies listed on the NASDAQ. It is a modified capitalization-weighted index. It is based on exchange and not an index of U.S.-based companies.
The Russell 2000 Index is a stock market index that measures the performance of the 2,000 smaller companies included in the Russell 3000 Index. It is managed by London’s FTSE Russell Group and is widely regarded as a bellwether of the U.S. economy because it focuses on smaller companies that focus on the U.S. market.
The NYSE advance/decline measure refers to the number of common stocks listed on the New York Stock Exchange (NYSE) that close at a higher price than their previous closing price (“advancing issues”) compared to the number of NYSE-listed common stocks that close at a lower price than their previous closing price (“declining issues”) during a specified trading session.
This measure is used as an indicator of market breadth and reflects the extent to which price movements are broadly distributed among NYSE-listed securities.