


Morning Brief

Headline News:
Equity futures point to a sharply lower opening this morning as concerns that the U.S. and Iran are not as close to a ceasefire as previously thought have sent oil prices surging.
Stocks are coming off a second consecutive session of solid gains, largely driven by hopes that the war in Iran will draw to a close soon. There were reports that President Trump told aides the U.S. will withdraw from military operations in the next two to three weeks.
Last night, President Trump addressed the nation on the conflict in Iran. While the President reiterated that the U.S. was nearing the completion of its objectives in Iran, the address came with renewed threats against Tehran and promises to “bring them back to the stone age.”
Additionally, The New York Times reports that U.S. intelligence agencies do not believe Iran is currently willing to engage in talks to end the war. Crude oil is currently up $9.23 (+9.2%) to $109.35 per barrel. On the data front, the market will receive the February Trade Balance (Briefing.com consensus -$55.8 billion) at 8:30 a.m. ET, alongside the weekly initial jobless claims report (Briefing.com consensus 215K).
(Michael Gibbs, Managing Director, Lead Portfolio Manager |)
Markets:
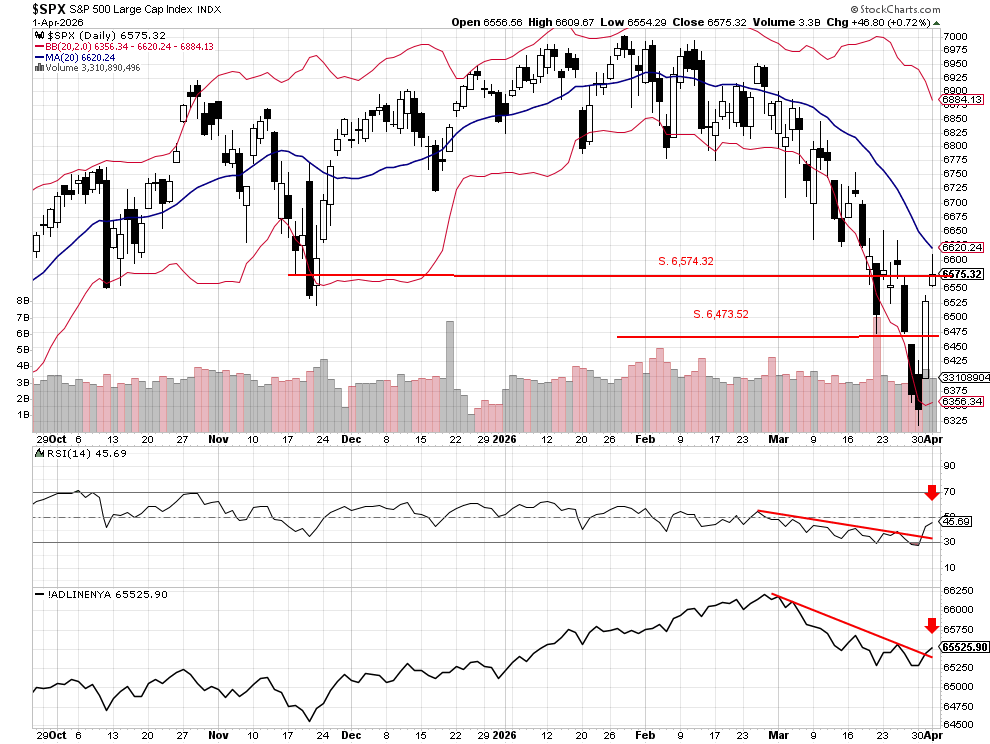
The S&P 500 rallied for a second consecutive session, closing higher at 6,575.32. The index pushed up toward the 20-day moving average at 6,620.24, where sellers emerged late in the day, reinforcing that level as near-term resistance.
Notably, both the RSI and the Advance-Decline line moved higher, confirming improving internal momentum behind the advance. However, up volume accounted for just 53% of total volume, indicating the move lacked the conviction required for a true follow-through day after Tuesday’s sharp rally.
So far this morning, S&P 500 futures are lower by 1.50%, which would be considered a normal pullback following a two-day advance that cleared multiple resistance levels. If the index can hold and close above the key support level at 6,473.52, the current weakness would be viewed as orderly profit-taking within a developing recovery phase.
John N. Lilly III CPFA
Accredited Portfolio Management Advisor℠
Accredited Asset Management Specialist℠
Portfolio Manager, RJFS
Partner, DJWMG
Windsor Wealth Planners & Strategists
Futures trading is speculative, leveraged, and involves substantial risks. Investing always involves risk, including the loss of principal, and futures trading could present additional risk based on underlying commodities investments.
The Relative Strength Index (RSI), developed by J. Welles Wilder, is a momentum oscillator that measures the speed and changes of price movements.
The percentage of stocks trading above a specific moving average is a breadth indicator that measures internal strength or weakness in the underlying index. The 50-day moving averages are used for short-to-medium-term timeframes, while the 150-day and 200-day moving averages are used for medium-to-long-term ones. Signals can be derived from overbought/oversold levels, crosses above/below 50%, and bullish/bearish divergences.
The Dow Jones Industrial Average (DJIA), commonly known as “The Dow,” is an index representing 30 stocks of companies maintained and reviewed by the editors of the Wall Street Journal. The Russell 2000 Index measures the performance of the 2,000 smallest companies in the Russell 3000 Index, which represents approximately 8% of the total market capitalization of the Russell 3000 Index.
The S&P 500 is an unmanaged index of 500 widely held stocks that is generally considered representative of the U.S. stock market. Past performance may not be indicative of future results. Keep in mind that individuals cannot invest directly in any index, and index performance does not include transaction costs or other fees, which will affect actual investment performance. Individual investors’ results will vary. Opinions expressed are those of the author, John N. Lilly III, and not necessarily those of Raymond James. “There is no guarantee that these statements, opinions, or forecast provided herein will prove to be correct. “The information contained was received from sources believed to be reliable, but accuracy is not guaranteed. Investing always involves risk, and you may incur a profit or loss. No investment strategy can guarantee success. The charts and/or tables presented herein are for illustrative purposes only and should not be considered as the sole basis for your investment decision. International investing involves special risks, including currency fluctuations, different financial accounting standards, and possible political and economic volatility. Investing in emerging markets can be riskier than investing in well-established foreign markets.
This is not a recommendation to buy or sell any company’s stock mentioned above.
US government bonds and treasury bills are guaranteed by the US government and, if held to maturity, offer a fixed rate of return and guaranteed principal value. US government bonds are issued and guaranteed due to the federal government’s timely principal and interest payment. Bond prices and yields are subject to change based on market conditions and availability. If bonds are sold prior to maturity, you may receive more or less than your initial investment. Holding bonds to term allows redemption at par value. There is an inverse relationship between interest rate movements and bond prices. Generally, when interest rates rise, bond prices fall, and when interest rates fall, bond prices generally rise.
The Nasdaq 100 (^NDX) is a stock market index made up of 103 equity securities issued by 100 of the largest non-financial companies listed on the NASDAQ. It is a modified capitalization-weighted index. It is based on exchange and not an index of U.S.-based companies.
The Russell 2000 Index is a stock market index that measures the performance of the 2,000 smaller companies included in the Russell 3000 Index. It is managed by London’s FTSE Russell Group and is widely regarded as a bellwether of the U.S. economy because it focuses on smaller companies that focus on the U.S. market.
The NYSE advance/decline measure refers to the number of common stocks listed on the New York Stock Exchange (NYSE) that close at a higher price than their previous closing price (“advancing issues”) compared to the number of NYSE-listed common stocks that close at a lower price than their previous closing price (“declining issues”) during a specified trading session.
This measure is used as an indicator of market breadth and reflects the extent to which price movements are broadly distributed among NYSE-listed securities.