


Morning Brief
![]()
Headline News:
Wall Street was set to open lower as concerns over a slowing economy and tapering of monetary stimulus. This, along with the continued spread of the delta variant, has the S&P 500 set for the worst weekly performance since mid-June. Also, WTI crude oil was down 9% for the week, along with copper down 7%. Investors appear to be turning cautious and worried the trading could be choppy going forward.
Markets:
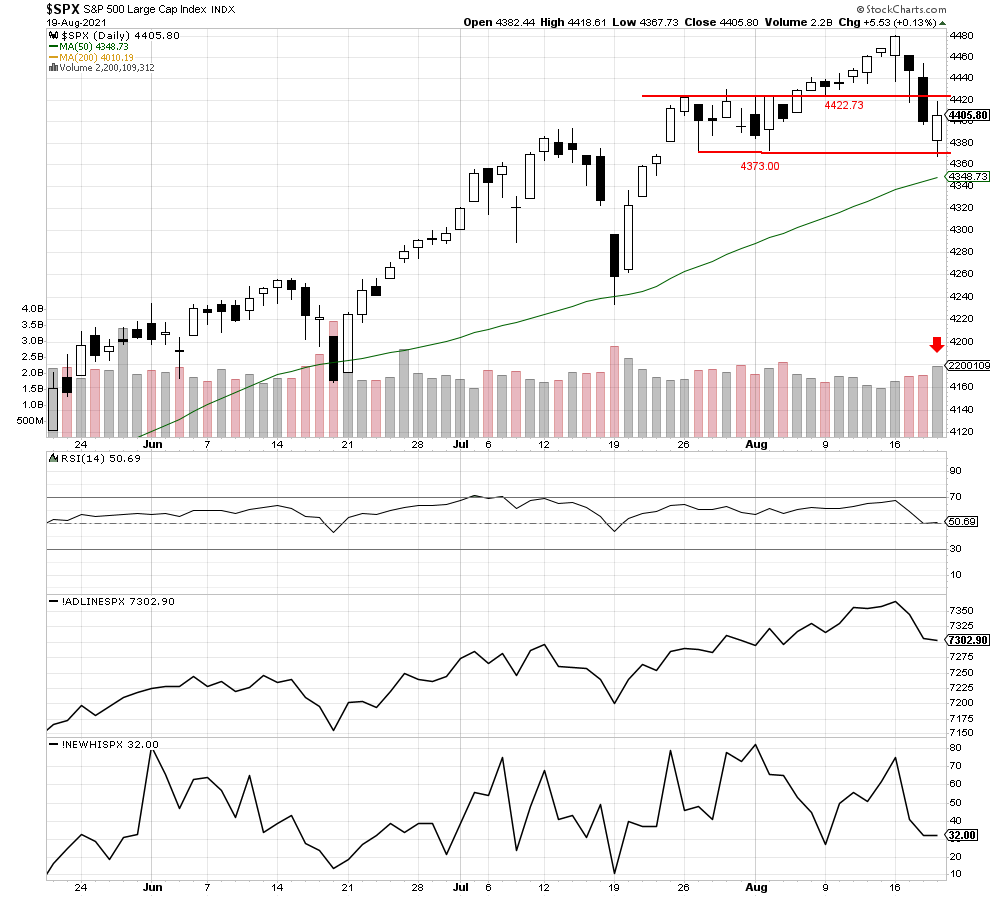
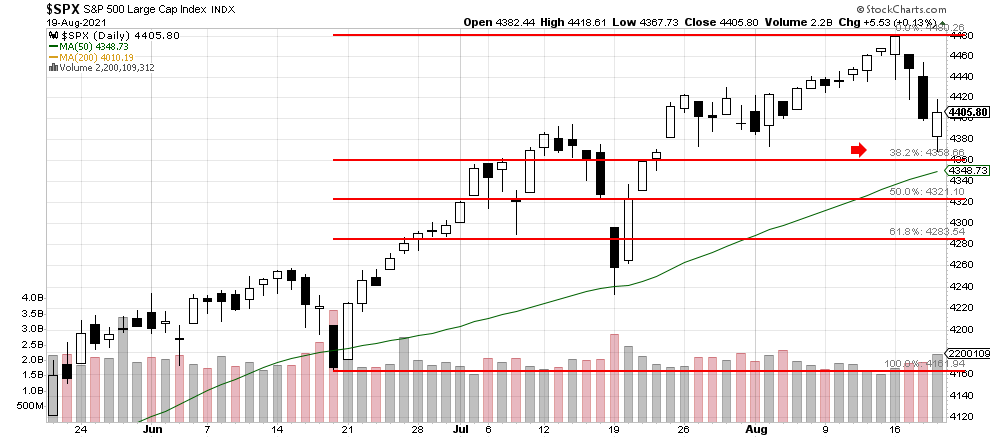
The S&P 500 moved down to support at 4373.00, briefly moved lower, and then rallied to end the day higher at 4405.80. The trading came with increased volume as 2,200,109,312 shares were traded. The index also moved close to a 38.2% Fibonacci level, so we know there are now two possible support levels at the same price level. So, there could be a retest of these support levels today and then a likely late-day rally again. If so, we believe the recent sell-off could be over for now.
We are currently Intermediate-term bullish and short-term bearish.
John N. Lilly III CPFA
Accredited Portfolio Management Advisor℠
Accredited Asset Management Specialist℠
Portfolio Manager, RJFS
Partner, DJWMG
Windsor Wealth Planners & Strategist
Futures trading is speculative, leveraged, and involves substantial risks. Investing always involves risk, including the loss of principal, and futures trading could present additional risk based on underlying commodities investments.
The Relative Strength Index (RSI), developed by J. Welles Wilder, is a momentum oscillator that measures the speed and changes of price movements.
The advance/decline line (A/D) is a technical indicator that plots the difference between the number of advancing and declining stocks on a daily basis. The indicator is cumulative, with a positive number being added to the prior number, or if the number is negative it is subtracted from the prior number.
The A/D line is used to show market sentiment, as it tells traders whether there are more stocks rising or falling. It is used to confirm price trends in major indexes, and can also warn of reversals when divergence occurs.
Net New 52-Week Highs is a simple breadth indicator found by subtracting new lows from new highs. “New lows” is the number of stocks recording new 52-week lows. “New highs” is the number of stocks making new 52-week highs. This indicator provides an immediate score for internal strength or weakness in the market. There are more new highs when the indicator is positive, which favors the bulls. There are more new lows when the indicator is negative, which favors the bears. Chartists can analyze daily fluctuations or apply a moving average to create an oscillator that meanders above and below the zero line. Net New Highs can also be used like the AD Line by creating a High-Low Line based on cumulative Net New Highs.
The S&P 500 is an unmanaged index of 500 widely held stocks that is generally considered representative of the U.S stock market. Past performance may not be indicative of future results. Keep in mind that individuals cannot invest directly in any index, and index performance does not include transaction costs or other fees, which will affect actual investment performance. Individual investors’ results will vary. Opinions expressed are those of the author John N. Lilly III, and not necessarily those of Raymond James. “There is no guarantee that these statements, opinions, or forecast provided herein will prove to be correct. “The information contained was received from sources believed to be reliable, but accuracy is not guaranteed. Investing always involves risk, and you may incur a profit or loss. No investment strategy can guarantee success. The charts and/or tables presented herein are for illustrative purposes only and should not be considered as the sole basis for your investment decision. International investing involves special risks, including currency fluctuations, different financial accounting standards, and possible political and economic volatility. Investing in emerging markets can be riskier than investing in well-established foreign markets.
This is not a recommendation to buy or sell any company’s stock mentioned above.
US government bonds and treasury bills are guaranteed by the US government and, if held to maturity, offer a fixed rate of return and guaranteed principal value. US government bonds are issued and guaranteed as to the timely payment of principal and interest by the federal government. Bond prices and yields are subject to change based upon market conditions and availability. If bonds are sold prior to maturity, you may receive more or less than your initial investment. Holding bonds to term allows redemption at par value. There is an inverse relationship between interest rate movements and bond prices. Generally, when interest rates rise, bond prices fall and when interest rates fall, bond prices generally rise.
- Fibonacci retracement levels are horizontal lines that indicate where support and resistance are likely to occur. They are based on Fibonacci numbers. Each level is associated with a percentage. The percentage is how much of a prior move the price has retraced. The Fibonacci retracement levels are 23.6%, 38.2%, 61.8%, and 78.6%. While not officially a Fibonacci ratio, 50% is also used.
The indicator is useful because it can be drawn between any two significant price points, such as a high and a low. The indicator will then create the levels between those two points.
Suppose the price of a stock rises $10 and then drops $2.36. In that case, it has retraced 23.6%, which is a Fibonacci number. Fibonacci numbers are found throughout nature. Therefore, many traders believe that these numbers also have relevance in financial markets.