


Morning Brief

Headline News:
Equity futures point to a lower opening this morning after the major averages finished lower on Friday and mostly lower for the week.
Stocks had a somewhat choppy previous week following mixed reactions to a batch of highly anticipated mega-cap earnings reports. The market will have plenty of high-profile earnings reports to assess this week, including those from a few Mag 7 companies.
This week will also feature some key employment data, including the December JOLTS report on Tuesday and the January Employment Situation Report on Friday.
In Washington, the Senate has passed a bill to fund most government agencies through September 30 and DHS through February 13. The government will be shut down at least until Tuesday, as House Democrats oppose the funding bill and some conservatives want to attach an election reform bill to it, according to Politico.
Elsewhere, Axios reports that the Trump administration told Iran it is ready to meet and negotiate a deal, which has weighed on oil prices this morning.
(Michael Gibbs, Managing Director, Lead Portfolio Manager |)
Markets:
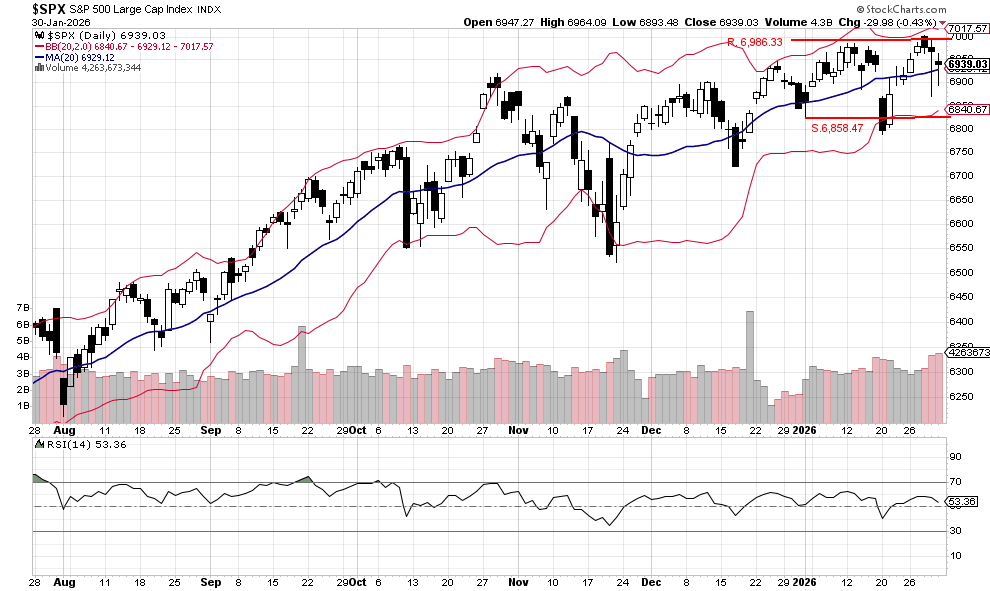
The S&P 500 traded below its 20-day moving average at 6,929.03, but buyers stepped in and the index managed to close higher at 6,939.03. However, the recent action may be sending a warning signal, as volume has been heavier on down days—suggesting distribution rather than healthy consolidation.
So far this morning, S&P 500 futures are lower by 0.48%, which will test buyer resolve for a third consecutive session. If sellers gain control, there is potential support at 6,858.47, a level we believe should hold if tested today.
We are currently Intermediate-term cautious and short-term bullish.
John N. Lilly III CPFA
Accredited Portfolio Management Advisor℠
Accredited Asset Management Specialist℠
Portfolio Manager, RJFS
Partner, DJWMG
Windsor Wealth Planners & Strategists
Futures trading is speculative, leveraged, and involves substantial risks. Investing always involves risk, including the loss of principal, and futures trading could present additional risk based on underlying commodities investments.
The Relative Strength Index (RSI), developed by J. Welles Wilder, is a momentum oscillator that measures the speed and changes of price movements.
The percentage of stocks trading above a specific moving average is a breadth indicator that measures internal strength or weakness in the underlying index. The 50-day moving averages are used for short-to-medium-term timeframes, while the 150-day and 200-day moving averages are used for medium-to-long-term ones. Signals can be derived from overbought/oversold levels, crosses above/below 50%, and bullish/bearish divergences.
The Dow Jones Industrial Average (DJIA), commonly known as “The Dow,” is an index representing 30 stocks of companies maintained and reviewed by the editors of the Wall Street Journal. The Russell 2000 Index measures the performance of the 2,000 smallest companies in the Russell 3000 Index, which represents approximately 8% of the total market capitalization of the Russell 3000 Index.
The S&P 500 is an unmanaged index of 500 widely held stocks that is generally considered representative of the U.S. stock market. Past performance may not be indicative of future results. Keep in mind that individuals cannot invest directly in any index, and index performance does not include transaction costs or other fees, which will affect actual investment performance. Individual investors’ results will vary. Opinions expressed are those of the author, John N. Lilly III, and not necessarily those of Raymond James. “There is no guarantee that these statements, opinions, or forecast provided herein will prove to be correct. “The information contained was received from sources believed to be reliable, but accuracy is not guaranteed. Investing always involves risk, and you may incur a profit or loss. No investment strategy can guarantee success. The charts and/or tables presented herein are for illustrative purposes only and should not be considered as the sole basis for your investment decision. International investing involves special risks, including currency fluctuations, different financial accounting standards, and possible political and economic volatility. Investing in emerging markets can be riskier than investing in well-established foreign markets.
This is not a recommendation to buy or sell any company’s stock mentioned above.
US government bonds and treasury bills are guaranteed by the US government and, if held to maturity, offer a fixed rate of return and guaranteed principal value. US government bonds are issued and guaranteed due to the federal government’s timely principal and interest payment. Bond prices and yields are subject to change based on market conditions and availability. If bonds are sold prior to maturity, you may receive more or less than your initial investment. Holding bonds to term allows redemption at par value. There is an inverse relationship between interest rate movements and bond prices. Generally, when interest rates rise, bond prices fall, and when interest rates fall, bond prices generally rise.
The Nasdaq 100 (^NDX) is a stock market index made up of 103 equity securities issued by 100 of the largest non-financial companies listed on the NASDAQ. It is a modified capitalization-weighted index. It is based on exchange and not an index of U.S.-based companies.
The Russell 2000 Index is a stock market index that measures the performance of the 2,000 smaller companies included in the Russell 3000 Index. It is managed by London’s FTSE Russell Group and is widely regarded as a bellwether of the U.S. economy because it focuses on smaller companies that focus on the U.S. market.