


Morning Brief

Headline News:
Equity futures point to a higher open at the start of the holiday-shortened week.
The major averages finished mixed last week, with tech names posting strong gains on Thursday and Friday. An uptick in sentiment around the AI trade helped the S&P 500 and NASDAQ Composite reclaim their 50-day moving average. Momentum seems to have extended through the weekend, with mega-cap tech mostly higher in the premarket.
Headlines are relatively quiet, with no economic data releases scheduled, though tomorrow’s session will feature a full data slate. There are no companies set to report earnings this week.
On the policy front, Cleveland Fed President Beth Hammack (FOMC voting member in 2026) told The Wall Street Journal that she expects rates to remain unchanged for some months, a view that reflects last week’s data and Fed commentary, which did little to alter market expectations for further easing.
The market will close at 1:00 p.m. ET on Wednesday and remain closed all day on Thursday for the Christmas holiday.
(Michael Gibbs, Managing Director, Lead Portfolio Manager )
Markets:
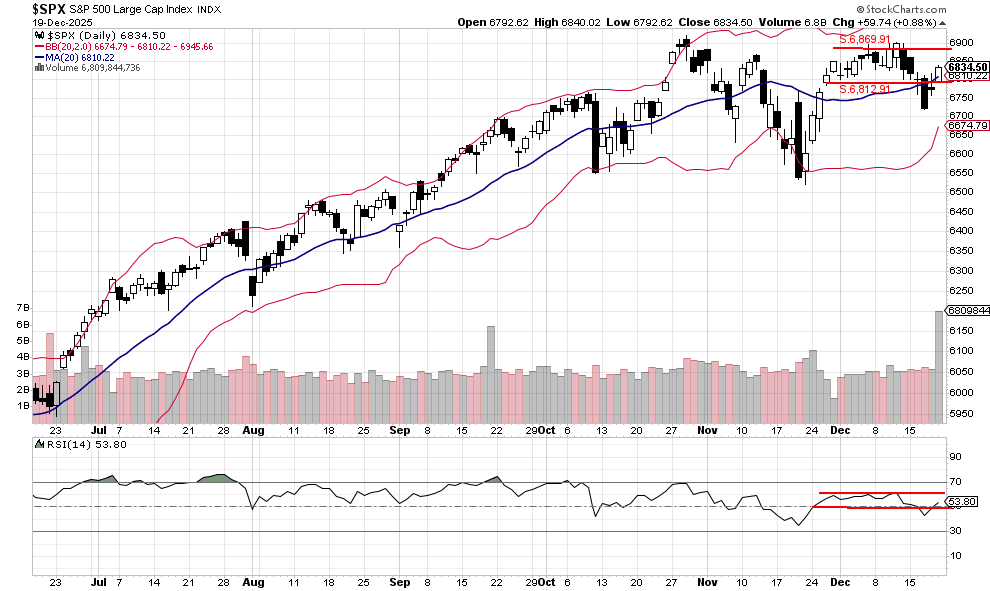
The S&P 500 rallied back above its 20-day moving average and closed back inside the 6,812.91–6,869.91 trading range. The RSI briefly moved above the 50 level before returning to its current range. This price action suggests the recent downtrend may be losing momentum and that a potential three-day rally heading into Christmas is possible. So far this morning, S&P 500 futures are up 0.42%, signaling a bullish start to the trading day.
We are currently Intermediate-term cautious and short-term bullish.
John N. Lilly III CPFA
Accredited Portfolio Management Advisor℠
Accredited Asset Management Specialist℠
Portfolio Manager, RJFS
Partner, DJWMG
Windsor Wealth Planners & Strategists
Futures trading is speculative, leveraged, and involves substantial risks. Investing always involves risk, including the loss of principal, and futures trading could present additional risk based on underlying commodities investments.
The Relative Strength Index (RSI), developed by J. Welles Wilder, is a momentum oscillator that measures the speed and changes of price movements.
The percentage of stocks trading above a specific moving average is a breadth indicator that measures internal strength or weakness in the underlying index. The 50-day moving averages are used for short-to-medium-term timeframes, while the 150-day and 200-day moving averages are used for medium-to-long-term ones. Signals can be derived from overbought/oversold levels, crosses above/below 50%, and bullish/bearish divergences.
The Dow Jones Industrial Average (DJIA), commonly known as “The Dow,” is an index representing 30 stocks of companies maintained and reviewed by the editors of the Wall Street Journal. The Russell 2000 Index measures the performance of the 2,000 smallest companies in the Russell 3000 Index, which represents approximately 8% of the total market capitalization of the Russell 3000 Index.
The S&P 500 is an unmanaged index of 500 widely held stocks that is generally considered representative of the U.S. stock market. Past performance may not be indicative of future results. Keep in mind that individuals cannot invest directly in any index, and index performance does not include transaction costs or other fees, which will affect actual investment performance. Individual investors’ results will vary. Opinions expressed are those of the author, John N. Lilly III, and not necessarily those of Raymond James. “There is no guarantee that these statements, opinions, or forecast provided herein will prove to be correct. “The information contained was received from sources believed to be reliable, but accuracy is not guaranteed. Investing always involves risk, and you may incur a profit or loss. No investment strategy can guarantee success. The charts and/or tables presented herein are for illustrative purposes only and should not be considered as the sole basis for your investment decision. International investing involves special risks, including currency fluctuations, different financial accounting standards, and possible political and economic volatility. Investing in emerging markets can be riskier than investing in well-established foreign markets.
This is not a recommendation to buy or sell any company’s stock mentioned above.
US government bonds and treasury bills are guaranteed by the US government and, if held to maturity, offer a fixed rate of return and guaranteed principal value. US government bonds are issued and guaranteed due to the federal government’s timely principal and interest payment. Bond prices and yields are subject to change based on market conditions and availability. If bonds are sold prior to maturity, you may receive more or less than your initial investment. Holding bonds to term allows redemption at par value. There is an inverse relationship between interest rate movements and bond prices. Generally, when interest rates rise, bond prices fall, and when interest rates fall, bond prices generally rise.
The Nasdaq 100 (^NDX) is a stock market index made up of 103 equity securities issued by 100 of the largest non-financial companies listed on the NASDAQ. It is a modified capitalization-weighted index. It is based on exchange and not an index of U.S.-based companies.
The Russell 2000 Index is a stock market index that measures the performance of the 2,000 smaller companies included in the Russell 3000 Index. It is managed by London’s FTSE Russell Group and is widely regarded as a bellwether of the U.S. economy because it focuses on smaller companies that focus on the U.S. market.