


Morning Brief

Headline News:
The S&P 500 futures are up 20 points and are trading 0.5% above fair value, the Nasdaq 100 futures are up 110 points and are trading 0.6% above fair value, and the Dow Jones Industrial Average futures are up 105 points and are trading 0.3% above fair value.
The market looks ready to reclaim some lost ground following yesterday’s everything retreat. Pre-open gains in mega cap stocks have provided a boost to the broader market. Treasury yields are also pulling back somewhat this morning. The 2-yr note yield is down five basis points to 4.62% after jumping 20 basis points yesterday. The 10-yr note yield is down two basis points to 4.30% after rising 14 basis points yesterday.
Inflation data from the UK was cooler than expected. CPI dropped 0.6% month-over-month versus an expected 0.3% decline. The year-over-year number remained steady from last month at 4.0% versus expectations for a slight increase to 4.1%.
The eurozone reported much better than expected industrial production in December, jumping 2.6% month-over-month versus expectations for a 0.2% decline.
Today’s US economic data is limited to the weekly MBA Mortgage Applications Index, which dropped 2.3% versus a 3.7% increase last week, and the weekly EIA Crude Oil Inventories at 10:30 ET. Also, the recalculated seasonal adjustment factors for the Producer Price Indexes will be released today at 8:30 ET.
(Michael Gibbs, Managing Director, Lead Portfolio Manager)
Markets:
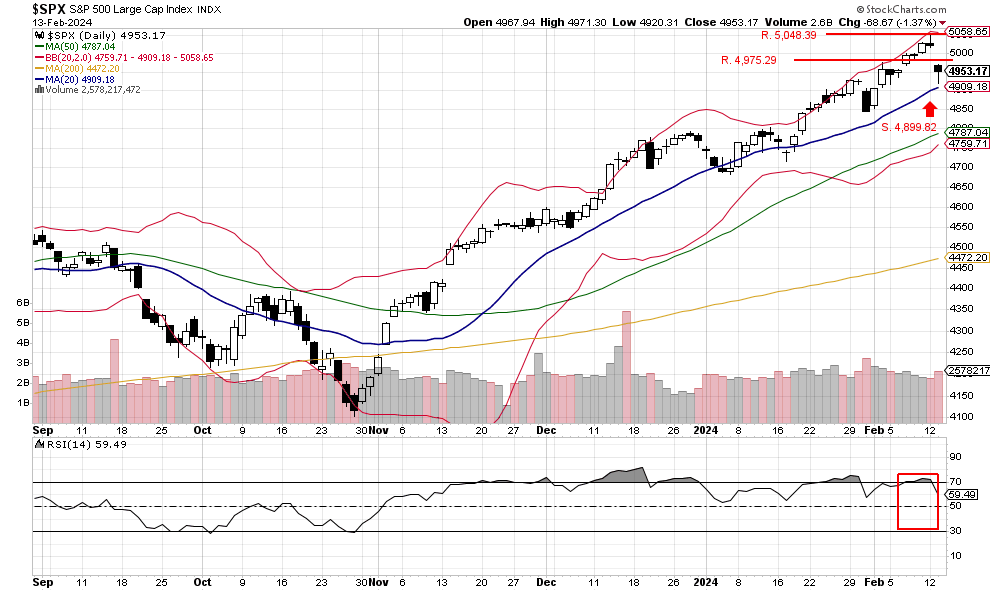
The S&P 500 sold off 1.37% and closed at 4,953.17 after an increase in inflation was reported for January. The index traded down to the 20-day moving average at 4,909.18, and buyers returned to the market. The volume was above average, and 92% was down volume, the first down volume of 90% or better day since December. The RSI index moved below 70 and also closed sharply lower at 59.49, suggesting there could be more selling. A close above potential resistance at 4,975.29 could possibly signify that the selling was a one-day event.
We are currently Intermediate-term bullish and short-term bullish.
John N. Lilly III CPFA
Accredited Portfolio Management Advisor℠
Accredited Asset Management Specialist℠
Portfolio Manager, RJFS
Partner, DJWMG
Windsor Wealth Planners & Strategist
Futures trading is speculative, leveraged, and involves substantial risks. Investing always involves risk, including the loss of principal, and futures trading could present additional risk based on underlying commodities investments.
The Relative Strength Index (RSI), developed by J. Welles Wilder, is a momentum oscillator that measures the speed and changes of price movements.
.The percentage of stocks trading above a specific moving average is a breadth indicator that measures internal strength or weakness in the underlying index. The 50-day moving average is used for short-to-medium-term timeframes, while the 150-day and 200-day moving averages are used for medium-to-long-term timeframes. Signals can be derived from overbought/oversold levels, crosses above/below 50%, and bullish/bearish divergences.
The Dow Jones Industrial Average (DJIA), commonly known as “The Dow,” is an index representing 30 stocks of companies maintained and reviewed by the editors of the Wall Street Journal. The Russell 2000 Index measures the performance of the 2,000 smallest companies in the Russell 3000 Index, which represent approximately 8% of the total market capitalization of the Russell 3000 Index.
The S&P 500 is an unmanaged index of 500 widely held stocks that is generally considered representative of the U.S stock market. Past performance may not be indicative of future results. Keep in mind that individuals cannot invest directly in any index, and index performance does not include transaction costs or other fees, which will affect actual investment performance. Individual investors’ results will vary. Opinions expressed are those of the author, John N. Lilly III, and not necessarily those of Raymond James. “There is no guarantee that these statements, opinions, or forecast provided herein will prove to be correct. “The information contained was received from sources believed to be reliable, but accuracy is not guaranteed. Investing always involves risk, and you may incur a profit or loss. No investment strategy can guarantee success. The charts and/or tables presented herein are for illustrative purposes only and should not be considered as the sole basis for your investment decision. International investing involves special risks, including currency fluctuations, different financial accounting standards, and possible political and economic volatility. Investing in emerging markets can be riskier than investing in well-established foreign markets.
This is not a recommendation to buy or sell any company’s stock mentioned above.
US government bonds and treasury bills are guaranteed by the US government and, if held to maturity, offer a fixed rate of return and guaranteed principal value. US government bonds are issued and guaranteed as to the timely payment of principal and interest by the federal government. Bond prices and yields are subject to change based on market conditions and availability. If bonds are sold prior to maturity, you may receive more or less than your initial investment. Holding bonds to term allows redemption at par value. There is an inverse relationship between interest rate movements and bond prices. Generally, when interest rates rise, bond prices fall, and when interest rates fall, bond prices generally rise.
The Nasdaq 100 (^NDX) is a stock market index made up of 103 equity securities issued by 100 of the largest non-financial companies listed on the NASDAQ. It is a modified capitalization-weighted index. It is based on exchange, and it is not an index of U.S.-based companies.