


Morning Brief
![]()
Headline News:
Wall Street is set for a higher open as second-quarter earnings are coming in better than expected. Shares of IBM (IBM) were higher after strong Q2 earnings, and interest rate sensitive bank stocks Citigroup (C), JPMorgan (JPM), and Goldman Sachs (GS) were also higher. So far, 41 S&P 500 companies have reported earnings, and 90% have beaten expectations. Investors appear to be more focused on the long-term outlook for corporations and, for now, see the Delta variant as a short-term situation.
Markets:
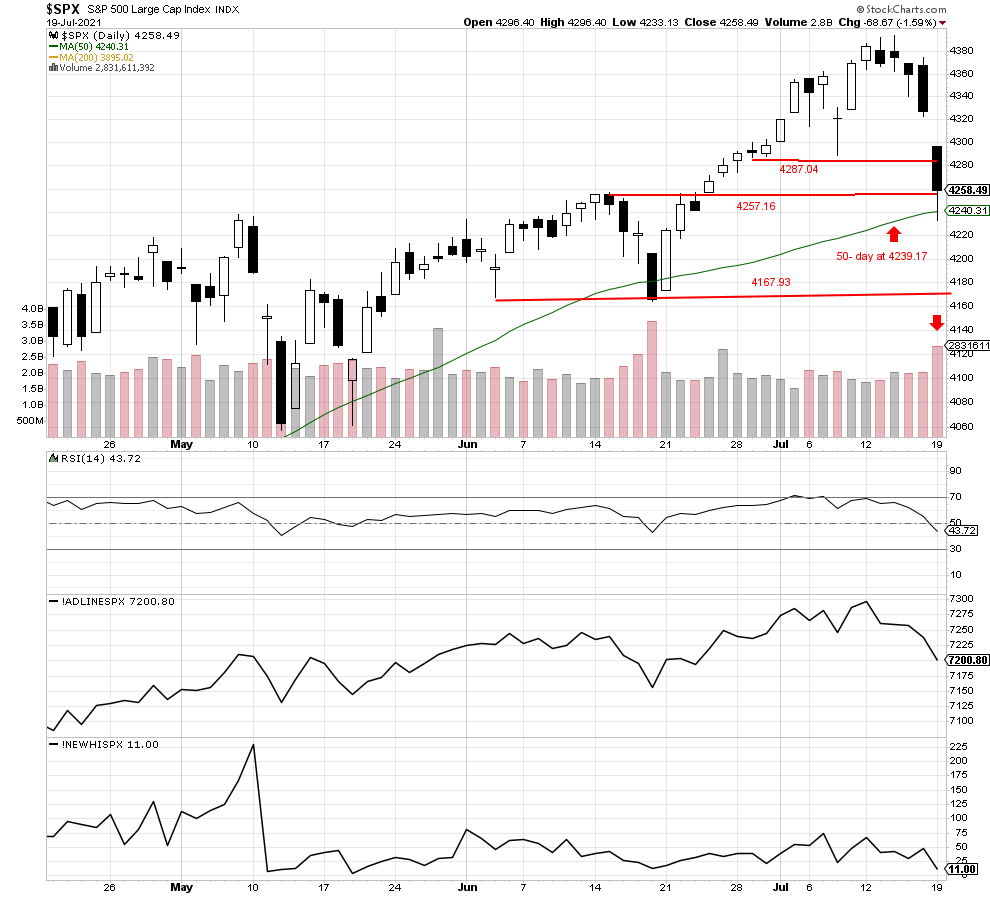
The S&P 500 had a massive sell-off and moved below three support levels only to rally late to close lower at 4258.49. The index briefly breached the 50-day moving average, but buying came in near where we thought it would. The volume was huge, with 2,831,611,392 shares traded, and down volume accounted for 85% of the trading. The index could see dip buyers come in early this morning and even test potential resistance at 4287.04. However, we still believe more selling is coming, and another test of the 50-day average could possibly occur soon.
We are currently long-term bullish and short-term bearish.
John N. Lilly III CPFA
Accredited Portfolio Management Advisor℠
Accredited Asset Management Specialist℠
Portfolio Manager, RJFS
Partner, DJWMG
Windsor Wealth Planners & Strategist
Futures trading is speculative, leveraged, and involves substantial risks. Investing always involves risk, including the loss of principal, and futures trading could present additional risk based on underlying commodities investments.
The Relative Strength Index (RSI), developed by J. Welles Wilder, is a momentum oscillator that measures the speed and changes of price movements.
The advance/decline line (A/D) is a technical indicator that plots the difference between the number of advancing and declining stocks on a daily basis. The indicator is cumulative, with a positive number being added to the prior number, or if the number is negative it is subtracted from the prior number.
The A/D line is used to show market sentiment, as it tells traders whether there are more stocks rising or falling. It is used to confirm price trends in major indexes, and can also warn of reversals when divergence occurs.
The S&P 500 is an unmanaged index of 500 widely held stocks that is generally considered representative of the U.S stock market. Past performance may not be indicative of future results. Keep in mind that individuals cannot invest directly in any index, and index performance does not include transaction costs or other fees, which will affect actual investment performance. Individual investors’ results will vary. Opinions expressed are those of the author John N. Lilly III, and not necessarily those of Raymond James. “There is no guarantee that these statements, opinions, or forecast provided herein will prove to be correct. “The information contained was received from sources believed to be reliable, but accuracy is not guaranteed. Investing always involves risk, and you may incur a profit or loss. No investment strategy can guarantee success. The charts and/or tables presented herein are for illustrative purposes only and should not be considered as the sole basis for your investment decision. International investing involves special risks, including currency fluctuations, different financial accounting standards, and possible political and economic volatility. Investing in emerging markets can be riskier than investing in well-established foreign markets.
This is not a recommendation to buy or sell any company’s stock mentioned above.
US government bonds and treasury bills are guaranteed by the US government and, if held to maturity, offer a fixed rate of return and guaranteed principal value. US government bonds are issued and guaranteed as to the timely payment of principal and interest by the federal government. Bond prices and yields are subject to change based upon market conditions and availability. If bonds are sold prior to maturity, you may receive more or less than your initial investment. Holding bonds to term allows redemption at par value. There is an inverse relationship between interest rate movements and bond prices. Generally, when interest rates rise, bond prices fall and when interest rates fall, bond prices generally rise.