


Morning Brief
![]()
Headline News:
The S&P 500 futures are down 4 points and are trading slightly below fair value. The NASDAQ 100 futures are down 15 points and are trading 0.1% below fair value. The Dow Jones Industrial Average futures are down 14 points and are trading slightly below fair value.
Stock futures are flattish as investors await key events later this week, including the FOMC decision on Wednesday, the ECB meeting, and the April Employment Report on Friday.
At 10:00 a.m. ET, market participants will receive the April ISM Manufacturing Index (Briefing.com consensus 46.8%; prior 46.3%). This comes after China reported weaker-than-expected PMI data for April (actual 49.2; expected 51.4).
Other U.S. economic data today includes the final IHS Markit Manufacturing PMI (prior 50.4) for April at 9:45 a.m. ET and the Construction Spending report (Briefing.com consensus +0.1%; prior -0.1%) for March at 10:00 a.m. ET
Treasuries are little changed from Friday’s settlement levels. The 2-yr note yield is unchanged at 4.06%, and the 10-yr note yield is up one basis point to 3.46%. The U.S. Dollar Index is up 0.2% to 101.83.
Energy complex futures are moving lower. WTI crude oil futures are down 2.1% to $75.14/bbl, and natural gas futures are down 0.9% to $2.56/mmbtu.
(Michael Gibbs, Director of Equity Portfolio & Technical Strategy)
Markets:
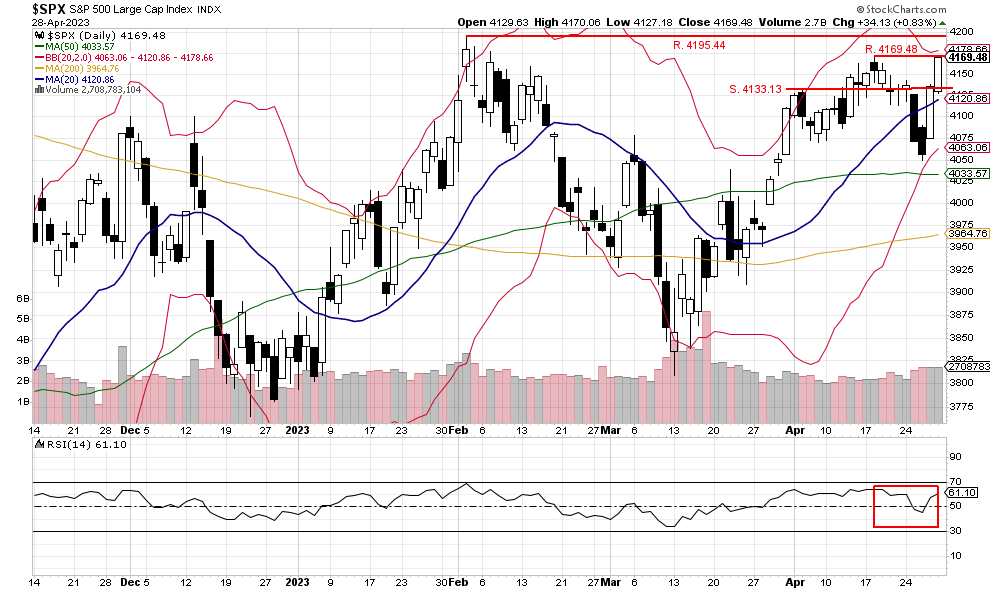
The S&P 500 rallied for a second day closing higher at 416948 and right on the resistance line at the same price. The RSI index also increased to support the rally closing higher at 61.10 but did not close near the high. The volume was again higher, and the up volume was 75% of the total volume showing the buying was strong. However, we were looking for an 80% or better up-volume day to confirm the recent rally, so the index still has some work to do today. We feel the trading could be flat as the S&P 500 consolidates the recent gains.
We are currently Intermediate-term bullish and short-term bullish.
John N. Lilly III CPFA
Accredited Portfolio Management Advisor℠
Accredited Asset Management Specialist℠
Portfolio Manager, RJFS
Partner, DJWMG
Windsor Wealth Planners & Strategist
Futures trading is speculative, leveraged, and involves substantial risks. Investing always involves risk, including the loss of principal, and futures trading could present additional risk based on underlying commodities investments.
The Relative Strength Index (RSI), developed by J. Welles Wilder, is a momentum oscillator that measures the speed and changes of price movements.
The advance/decline line (A/D) is a technical indicator that plots the difference between the number of advancing and declining stocks on a daily basis. The indicator is cumulative, with a positive number being added to the prior number, or if the number is negative, it is subtracted from the prior number.
The A/D line is used to show market sentiment, as it tells traders whether there are more stocks rising or falling. It is used to confirm price trends in major indexes and can also warn of reversals when divergence occurs.
The percentage of stocks trading above a specific moving average is a breadth indicator that measures internal strength or weakness in the underlying index. The 50-day moving average is used for short-to-medium-term timeframes, while the 150-day and 200-day moving averages are used for medium-to-long-term timeframes. Signals can be derived from overbought/oversold levels, crosses above/below 50%, and bullish/bearish divergences.
The Dow Jones Industrial Average (DJIA), commonly known as “The Dow,” is an index representing 30 stocks of companies maintained and reviewed by the editors of the Wall Street Journal. The Russell 2000 Index measures the performance of the 2,000 smallest companies in the Russell 3000 Index, which represent approximately 8% of the total market capitalization of the Russell 3000 Index.
The S&P 500 is an unmanaged index of 500 widely held stocks that is generally considered representative of the U.S stock market. Past performance may not be indicative of future results. Keep in mind that individuals cannot invest directly in any index, and index performance does not include transaction costs or other fees, which will affect actual investment performance. Individual investors’ results will vary. Opinions expressed are those of the author John N. Lilly III, and not necessarily those of Raymond James. “There is no guarantee that these statements, opinions, or forecast provided herein will prove to be correct. “The information contained was received from sources believed to be reliable, but accuracy is not guaranteed. Investing always involves risk, and you may incur a profit or loss. No investment strategy can guarantee success. The charts and/or tables presented herein are for illustrative purposes only and should not be considered as the sole basis for your investment decision. International investing involves special risks, including currency fluctuations, different financial accounting standards, and possible political and economic volatility. Investing in emerging markets can be riskier than investing in well-established foreign markets.
This is not a recommendation to buy or sell any company’s stock mentioned above.
US government bonds and treasury bills are guaranteed by the US government and, if held to maturity, offer a fixed rate of return and guaranteed principal value. US government bonds are issued and guaranteed as to the timely payment of principal and interest by the federal government. Bond prices and yields are subject to change based on market conditions and