


Morning Brief
![]()
Headline News:
U.S. stock futures climbed on Wednesday morning after a key inflation reading showed that consumer prices rose less than expected in March.
Futures tied to the S&P 500 traded 0.8% higher. Dow Jones Industrial Average futures advanced 221 points, or 0.6%, while Nasdaq-100 futures jumped 1%.
The March consumer price index showed a rise of 0.1% in March. Economists polled by Dow Jones were expecting CPI to rise by 0.2% month over month.
The report could impact the Federal Reserve’s rate decision come May. It may also cement the case for a stop to the central bank’s rate-hiking regime.
“It kind of feels like the calm before the storm,” said Ryan Detrick, chief market strategist at the Carson Group. “I mean its light volume, not a lot of big moves today. Traders are just kind of getting the eye on the prize, looking to that big CPI number.”
Minutes from the Federal Reserve’s March policy meeting are also due out Wednesday and slated to offer further clues into the mindset behind the central bank’s 25 basis point hike in the wake of Silicon Valley Bank’s collapse and the turmoil that rattled the broader banking sector.
(Samantha Subin CNBC)
Markets:
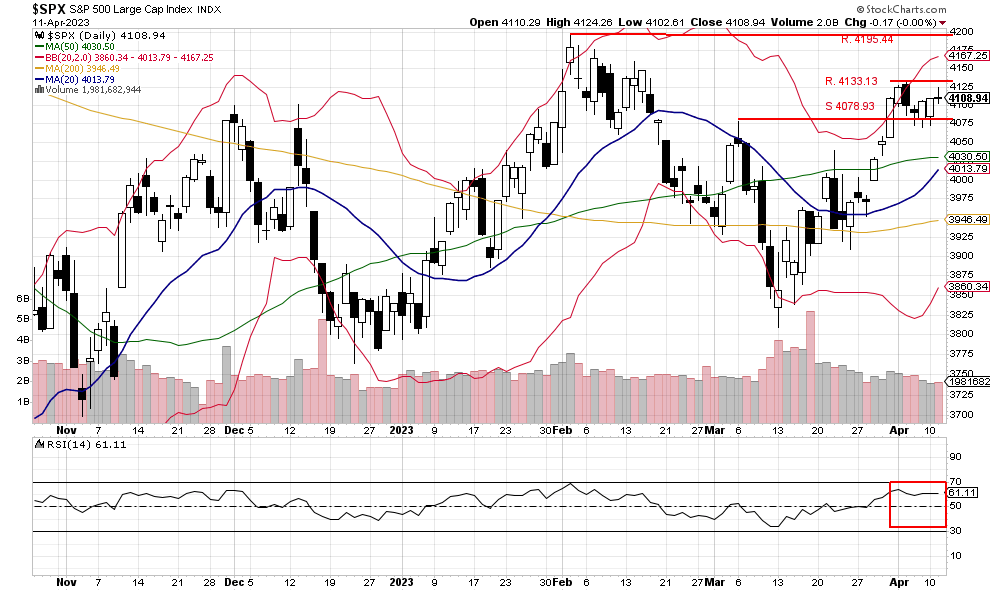
The S&P 500 trading was flat, and the index closed lower, little changed, at 4108.94. Volume came in lower again, with only 1,981,682,944 shares traded, while the RSI index was also little changed, closing at 61.11. So far this morning, the S&P 500 futures are higher by 0.90% with a suggested open of 4173.75. If that open holds, the index will take out the resistance at 4133.13 and bring the 2/2/23 high for the year at 4195.44 in as possible resistance. However, if that resistance level is tested today, we feel it will hold, but the recent uptrend may be back in place.
We are currently Intermediate-term bearish and short-term bullish.
John N. Lilly III CPFA
Accredited Portfolio Management Advisor℠
Accredited Asset Management Specialist℠
Portfolio Manager, RJFS
Partner, DJWMG
Windsor Wealth Planners & Strategist
Futures trading is speculative, leveraged, and involves substantial risks. Investing always involves risk, including the loss of principal, and futures trading could present additional risk based on underlying commodities investments.
The Relative Strength Index (RSI), developed by J. Welles Wilder, is a momentum oscillator that measures the speed and changes of price movements.
The advance/decline line (A/D) is a technical indicator that plots the difference between the number of advancing and declining stocks on a daily basis. The indicator is cumulative, with a positive number being added to the prior number, or if the number is negative, it is subtracted from the prior number.
The A/D line is used to show market sentiment, as it tells traders whether there are more stocks rising or falling. It is used to confirm price trends in major indexes and can also warn of reversals when divergence occurs.
The percentage of stocks trading above a specific moving average is a breadth indicator that measures internal strength or weakness in the underlying index. The 50-day moving average is used for short-to-medium-term timeframes, while the 150-day and 200-day moving averages are used for medium-to-long-term timeframes. Signals can be derived from overbought/oversold levels, crosses above/below 50%, and bullish/bearish divergences.
The Dow Jones Industrial Average (DJIA), commonly known as “The Dow,” is an index representing 30 stocks of companies maintained and reviewed by the editors of the Wall Street Journal. The Russell 2000 Index measures the performance of the 2,000 smallest companies in the Russell 3000 Index, which represent approximately 8% of the total market capitalization of the Russell 3000 Index.
The S&P 500 is an unmanaged index of 500 widely held stocks that is generally considered representative of the U.S stock market. Past performance may not be indicative of future results. Keep in mind that individuals cannot invest directly in any index, and index performance does not include transaction costs or other fees, which will affect actual investment performance. Individual investors’ results will vary. Opinions expressed are those of the author John N. Lilly III, and not necessarily those of Raymond James. “There is no guarantee that these statements, opinions, or forecast provided herein will prove to be correct. “The information contained was received from sources believed to be reliable, but accuracy is not guaranteed. Investing always involves risk, and you may incur a profit or loss. No investment strategy can guarantee success. The charts and/or tables presented herein are for illustrative purposes only and should not be considered as the sole basis for your investment decision. International investing involves special risks, including currency fluctuations, different financial accounting standards, and possible political and economic volatility. Investing in emerging markets can be riskier than investing in well-established foreign markets.
This is not a recommendation to buy or sell any company’s stock mentioned above.
US government bonds and treasury bills are guaranteed by the US government and, if held to maturity, offer a fixed rate of return and guaranteed principal value. US government bonds are issued and guaranteed as to the timely payment of principal and interest by the federal government. Bond prices and yields are subject to change based on market conditions and availability. If bonds are sold prior to maturity, you may receive more or less than your initial investment. Holding bonds to term allows redemption at par value. There is an inverse relationship between interest rate movements and bond prices. Generally, when interest rates rise, bond prices fall, and when interest rates fall, bond prices generally rise.
The Nasdaq 100 (^NDX) is a stock market index made up of 103 equity securities issued by 100 of the largest non-financial companies listed on the NASDAQ. It is a modified capitalization-weighted index. It is based on exchange, and it is not an index of U.S.-based companies.