


Morning Brief
![]()
Headline News:
The S&P 500 futures are up 1 point and are trading roughly in line with fair value. The Nasdaq 100 futures are up 12 points and are trading 0.1% above fair value. The Dow Jones Industrial Average futures are down 15 points and are trading roughly in line with fair value.
The equity futures market is mixed and little changed as participants lack conviction. There’s some mixed action in the mega-cap space this morning. Those stocks have exhibited fickle behavior recently, so market participants are in a wait-and-see mode ahead of the open.
The Santa Claus rally ended with a net gain over the seven-day stretch, which historically has been regarded as a positive sign for the start of the new year.
The second-ranking IMF official Gita Gopinath warned that the U.S. has not “turned the corner yet” on inflation, according to FT.
The House failed to elect a Speaker yesterday and will return to session at 12:00 p.m. ET today to resume the voting process.
The Treasury market trades in mixed fashion this morning. The 2-yr note yield is up two basis points to 4.39% and the 10-yr note yield is down two basis points to 3.70%.
WTI crude oil futures are up 2.0% to $74.28/bbl, and natural gas futures are down 2.8% to $3.67/mmbtu.
(Michael Gibbs, Director of Equity Portfolio & Technical Strategy)
Markets:
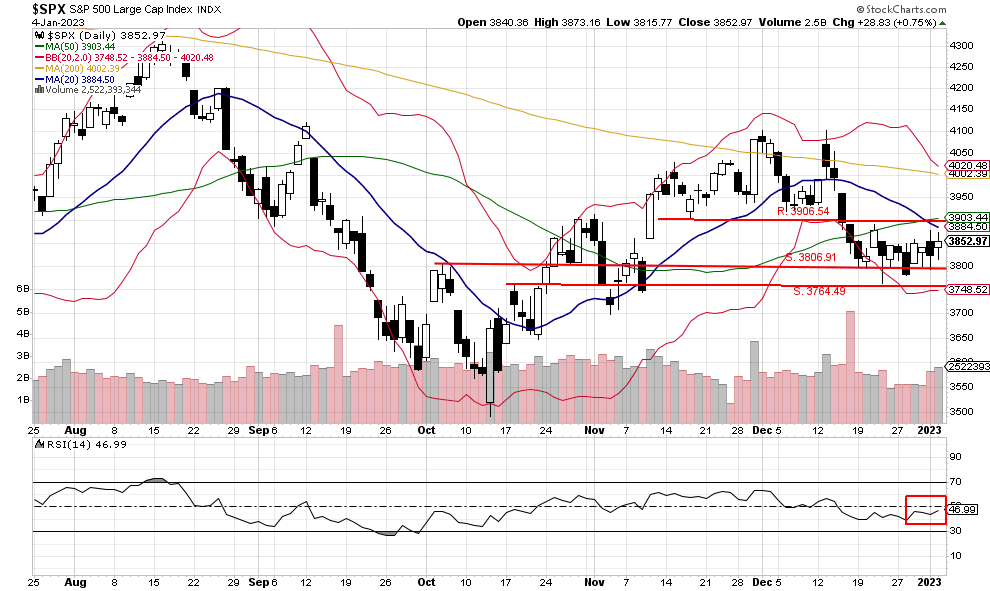
The S&P 500 closed higher at 3852.97 and at the upper end of the current trading range. There was an increase in the volume, with 2,522,393,344 shares traded, and 87% was upside volume showing strength for a possible test of the 50-day moving average at 3903.44.
However, RSI remains below the 50 level closing higher at 46.99, and we feel the RSI index needs to move higher before the S&P 500 can break out of the trading range. So far this morning, S&P 500 futures are lower by 0.50% with an indicated open of 3855.75 after a stronger-than-expected ADP private payrolls report was released this morning.
We are currently Intermediate-term bearish and short-term bearish.
John N. Lilly III CPFA
Accredited Portfolio Management Advisor℠
Accredited Asset Management Specialist℠
Portfolio Manager, RJFS
Partner, DJWMG
Windsor Wealth Planners & Strategist
Futures trading is speculative, leveraged, and involves substantial risks. Investing always involves risk, including the loss of principal, and futures trading could present additional risk based on underlying commodities investments.
The Relative Strength Index (RSI), developed by J. Welles Wilder, is a momentum oscillator that measures the speed and changes of price movements.
The advance/decline line (A/D) is a technical indicator that plots the difference between the number of advancing and declining stocks on a daily basis. The indicator is cumulative, with a positive number being added to the prior number, or if the number is negative, it is subtracted from the prior number.
The A/D line is used to show market sentiment, as it tells traders whether there are more stocks rising or falling. It is used to confirm price trends in major indexes and can also warn of reversals when divergence occurs.
The percentage of stocks trading above a specific moving average is a breadth indicator that measures internal strength or weakness in the underlying index. The 50-day moving average is used for short-to-medium-term timeframes, while the 150-day and 200-day moving averages are used for medium-to-long-term timeframes. Signals can be derived from overbought/oversold levels, crosses above/below 50%, and bullish/bearish divergences.
The Dow Jones Industrial Average (DJIA), commonly known as “The Dow,” is an index representing 30 stocks of companies maintained and reviewed by the editors of the Wall Street Journal. The Russell 2000 Index measures the performance of the 2,000 smallest companies in the Russell 3000 Index, which represent approximately 8% of the total market capitalization of the Russell 3000 Index.
The S&P 500 is an unmanaged index of 500 widely held stocks that is generally considered representative of the U.S stock market. Past performance may not be indicative of future results. Keep in mind that individuals cannot invest directly in any index, and index performance does not include transaction costs or other fees, which will affect actual investment performance. Individual investors’ results will vary. Opinions expressed are those of the author John N. Lilly III, and not necessarily those of Raymond James. “There is no guarantee that these statements, opinions, or forecast provided herein will prove to be correct. “The information contained was received from sources believed to be reliable, but accuracy is not guaranteed. Investing always involves risk, and you may incur a profit or loss. No investment strategy can guarantee success. The charts and/or tables presented herein are for illustrative purposes only and should not be considered as the sole basis for your investment decision. International investing involves special risks, including currency fluctuations, different financial accounting standards, and possible political and economic volatility. Investing in emerging markets can be riskier than investing in well-established foreign markets.
This is not a recommendation to buy or sell any company’s stock mentioned above.
US government bonds and treasury bills are guaranteed by the US government and, if held to maturity, offer a fixed rate of return and guaranteed principal value. US government bonds are issued and guaranteed as to the timely payment of principal and interest by the federal government. Bond prices and yields are subject to change based on market conditions and availability. If bonds are sold prior to maturity, you may receive more or less than your initial investment. Holding bonds to term allows redemption at par value. There is an inverse relationship between interest rate movements and bond prices. Generally, when interest rates rise, bond prices fall, and when interest rates fall, bond prices generally rise.
The Nasdaq 100 (^NDX) is a stock market index made up of 103 equity securities issued by 100 of the largest non-financial companies listed on the NASDAQ. It is a modified capitalization-weighted index. It is based on exchange, and it is not an index of U.S.-based companies.