


Morning Brief

Headline News:
The S&P 500 futures are up 32 points and are trading 0.9% above fair value. The Nasdaq 100 futures are up 69 points and are trading 0.7% above fair value. The Dow Jones Industrial Average futures are up 285 points and are trading 0.9% above fair value.
Equity futures are moving higher this morning, fueled by carryover upside momentum from last week’s turnaround effort. Global bond markets are also behaving better, acting as another upside-driving force.
The UK gilt is down 26 basis points to 3.80% with growing expectations that Rishi Sunak will be elected Prime Minister and amid reports that Finance Minister Hunt is looking to potentially raise taxes.
The 2-yr Treasury note yield is down four basis points to 4.46%, and the 10-yr note yield is down five basis points to 4.17%.
Germany and the U.K. reported weaker-than-expected flash Manufacturing PMI readings for October, while Services readings from France and the U.K. also missed expectations.
There is a notable weakness in Chinese stocks. Hong Kong’s Hang Seng dropped more than 6.0%. This comes after President Xi was elected to a third term, fueling worries about the state tightening control over the economy and carrying on with its zero Covid policy.
U.S. economic data is limited to the preliminary IHS Markit Manufacturing PMI (prior 52.0) and Services PMI (prior 49.3) for October.
(Michael Gibbs, Director of Equity Portfolio & Technical Strategy)
Markets:
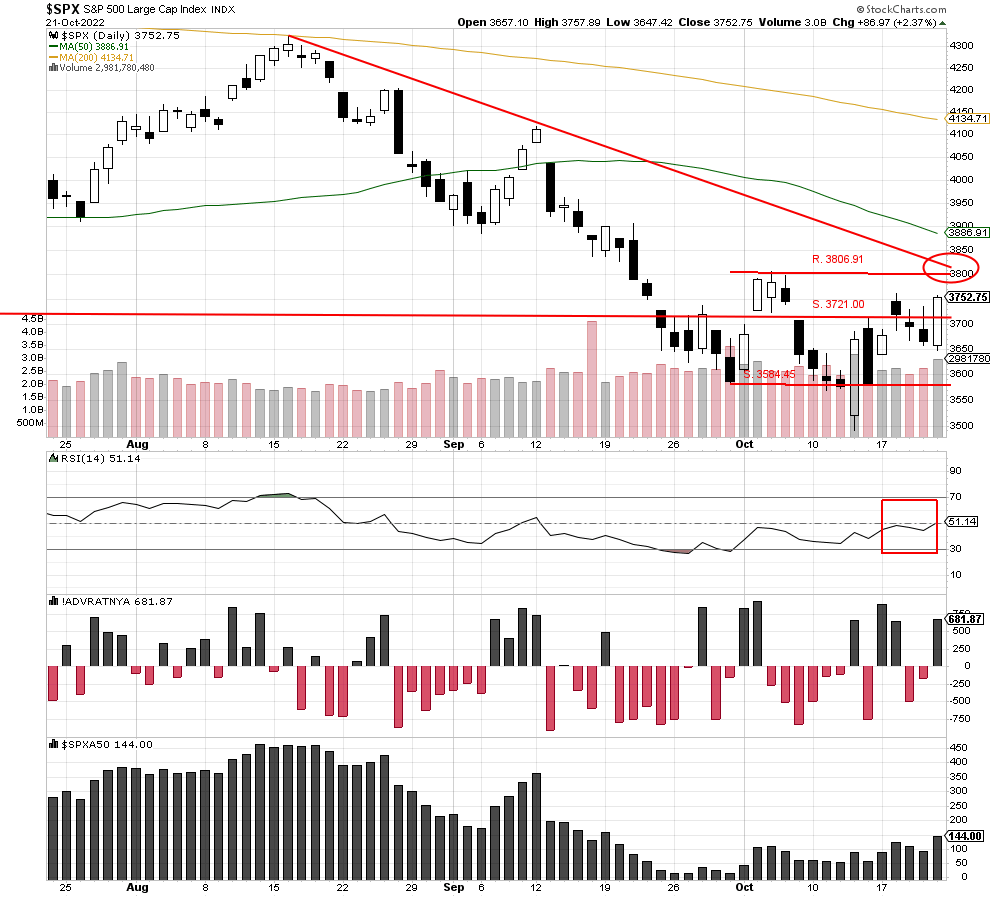
The S&P 500 rallied strongly on volume of 2,981,780,480, and up volume came in at 80%. The index moved past resistance at 3721.00 and closed higher at 3752.75, while RSI moved above the bullish 50% level. There is a short-term downtrend line just above the 3800 level, and a break of that soon level would set up a potential move to test the 50-day moving average. So far this morning, the index is set to open higher by 60% with a suggested open of 3787.00, so the momentum from last week has strongly carried over to start this week.
We are currently Intermediate-term bearish and short-term bearish.
John N. Lilly III CPFA
Accredited Portfolio Management Advisor℠
Accredited Asset Management Specialist℠
Portfolio Manager, RJFS
Partner, DJWMG
Windsor Wealth Planners & Strategist
Futures trading is speculative, leveraged, and involves substantial risks. Investing always involves risk, including the loss of principal, and futures trading could present additional risk based on underlying commodities investments.
The Relative Strength Index (RSI), developed by J. Welles Wilder, is a momentum oscillator that measures the speed and changes of price movements.
The advance/decline line (A/D) is a technical indicator that plots the difference between the number of advancing and declining stocks on a daily basis. The indicator is cumulative, with a positive number being added to the prior number, or if the number is negative, it is subtracted from the prior number.
The A/D line is used to show market sentiment, as it tells traders whether there are more stocks rising or falling. It is used to confirm price trends in major indexes and can also warn of reversals when divergence occurs.
The percentage of stocks trading above a specific moving average is a breadth indicator that measures internal strength or weakness in the underlying index. The 50-day moving average is used for short-to-medium-term timeframes, while the 150-day and 200-day moving averages are used for medium-to-long-term timeframes. Signals can be derived from overbought/oversold levels, crosses above/below 50%, and bullish/bearish divergences.
The Dow Jones Industrial Average (DJIA), commonly known as “The Dow,” is an index representing 30 stocks of companies maintained and reviewed by the editors of the Wall Street Journal. The Russell 2000 Index measures the performance of the 2,000 smallest companies in the Russell 3000 Index, which represent approximately 8% of the total market capitalization of the Russell 3000 Index.
The S&P 500 is an unmanaged index of 500 widely held stocks that is generally considered representative of the U.S stock market. Past performance may not be indicative of future results. Keep in mind that individuals cannot invest directly in any index, and index performance does not include transaction costs or other fees, which will affect actual investment performance. Individual investors’ results will vary. Opinions expressed are those of the author John N. Lilly III, and not necessarily those of Raymond James. “There is no guarantee that these statements, opinions, or forecast provided herein will prove to be correct. “The information contained was received from sources believed to be reliable, but accuracy is not guaranteed. Investing always involves risk, and you may incur a profit or loss. No investment strategy can guarantee success. The charts and/or tables presented herein are for illustrative purposes only and should not be considered as the sole basis for your investment decision. International investing involves special risks, including currency fluctuations, different financial accounting standards, and possible political and economic volatility. Investing in emerging markets can be riskier than investing in well-established foreign markets.
This is not a recommendation to buy or sell any company’s stock mentioned above.
US government bonds and treasury bills are guaranteed by the US government and, if held to maturity, offer a fixed rate of return and guaranteed principal value. US government bonds are issued and guaranteed as to the timely payment of principal and interest by the federal government. Bond prices and yields are subject to change based on market conditions and availability. If bonds are sold prior to maturity, you may receive more or less than your initial investment. Holding bonds to term allows redemption at par value. There is an inverse relationship between interest rate movements and bond prices. Generally, when interest rates rise, bond prices fall, and when interest rates fall, bond prices generally rise.
The Nasdaq 100 (^NDX) is a stock market index made up of 103 equity securities issued by 100 of the largest non-financial companies listed on the NASDAQ. It is a modified capitalization-weighted index. It is based on exchange, and it is not an index of U.S.-based companies.