


Morning Brief

Headline News:
The S&P 500 futures are down 19 points and are trading 0.5% below fair value. The Nasdaq 100 futures are down 64 points and are trading 0.5% below fair value. The Dow Jones Industrial Average futures are down 123 points and are trading 0.3% below fair value.
Equity futures indicate a lower open as market participants play a waiting game ahead of the FOMC Minutes for the September meeting and key PPI and CPI reports later this week. Participants are also responding to news of the Bank of England intervening again to support the Gilt market. Today the BoE said it will buy index-linked gilts to mitigate dysfunction in the market and “fire sale” dynamics.
The U.K.’s Pension and Lifetime Savings Association called on the Bank of England to continue its emergency Gilt buying program until at least the end of the month. GBP/USD +0.3% to 1.1087.
New restrictions were announced in Chinese cities amid rising COVID cases.
President Biden and G7 leaders are set to hold a virtual meeting today to discuss continued support of Ukraine, according to Reuters.
The 10-yr Treasury note yield, which reached 4.00% overnight, is up four basis points to 3.93%. The 2-yr note yield is unchanged at 4.31%.
Earlier this morning, the September NFIB Small Business Optimism reading came in at 92.1, following a reading of 91.8 in August.
(Michael Gibbs, Director of Equity Portfolio & Technical Strategy )
Markets:
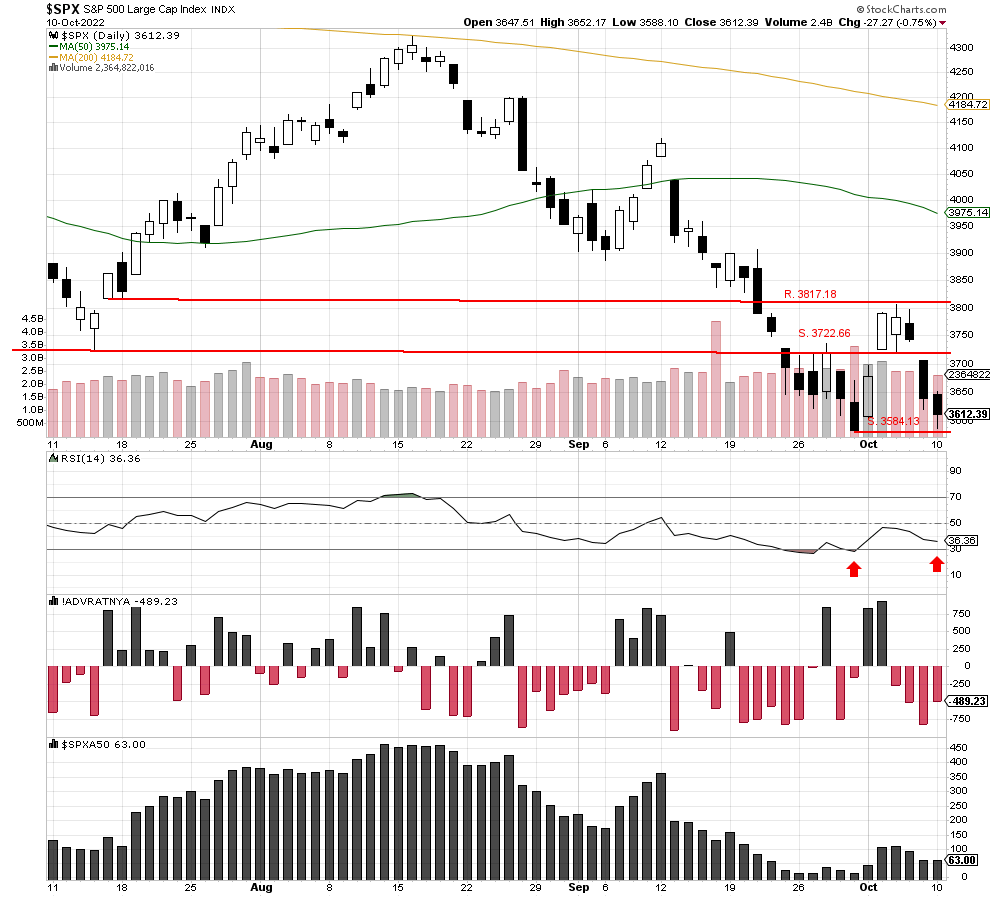
The S&P was down for the third day and closed at 3612.14. The index came close to possible support at 3584.13 but rallied later in the day. RSI has formed a negative divergent pattern, and we are encouraged the selling could be losing intensity soon. However, we will remain cautious until the index moves back above the potential resistance at 3722.66.
We are currently Intermediate-term bearish and short-term bearish.
John N. Lilly III CPFA
Accredited Portfolio Management Advisor℠
Accredited Asset Management Specialist℠
Portfolio Manager, RJFS
Partner, DJWMG
Windsor Wealth Planners & Strategist
Futures trading is speculative, leveraged, and involves substantial risks. Investing always involves risk, including the loss of principal, and futures trading could present additional risk based on underlying commodities investments.
The Relative Strength Index (RSI), developed by J. Welles Wilder, is a momentum oscillator that measures the speed and changes of price movements.
The advance/decline line (A/D) is a technical indicator that plots the difference between the number of advancing and declining stocks on a daily basis. The indicator is cumulative, with a positive number being added to the prior number, or if the number is negative, it is subtracted from the prior number.
The A/D line is used to show market sentiment, as it tells traders whether there are more stocks rising or falling. It is used to confirm price trends in major indexes and can also warn of reversals when divergence occurs.
The percentage of stocks trading above a specific moving average is a breadth indicator that measures internal strength or weakness in the underlying index. The 50-day moving average is used for short-to-medium-term timeframes, while the 150-day and 200-day moving averages are used for medium-to-long-term timeframes. Signals can be derived from overbought/oversold levels, crosses above/below 50%, and bullish/bearish divergences.
The Dow Jones Industrial Average (DJIA), commonly known as “The Dow,” is an index representing 30 stocks of companies maintained and reviewed by the editors of the Wall Street Journal. The Russell 2000 Index measures the performance of the 2,000 smallest companies in the Russell 3000 Index, which represent approximately 8% of the total market capitalization of the Russell 3000 Index.
The S&P 500 is an unmanaged index of 500 widely held stocks that is generally considered representative of the U.S stock market. Past performance may not be indicative of future results. Keep in mind that individuals cannot invest directly in any index, and index performance does not include transaction costs or other fees, which will affect actual investment performance. Individual investors’ results will vary. Opinions expressed are those of the author John N. Lilly III, and not necessarily those of Raymond James. “There is no guarantee that these statements, opinions, or forecast provided herein will prove to be correct. “The information contained was received from sources believed to be reliable, but accuracy is not guaranteed. Investing always involves risk, and you may incur a profit or loss. No investment strategy can guarantee success. The charts and/or tables presented herein are for illustrative purposes only and should not be considered as the sole basis for your investment decision. International investing involves special risks, including currency fluctuations, different financial accounting standards, and possible political and economic volatility. Investing in emerging markets can be riskier than investing in well-established foreign markets.
This is not a recommendation to buy or sell any company’s stock mentioned above.
US government bonds and treasury bills are guaranteed by the US government and, if held to maturity, offer a fixed rate of return and guaranteed principal value. US government bonds are issued and guaranteed as to the timely payment of principal and interest by the federal government. Bond prices and yields are subject to change based on market conditions and availability. If bonds are sold prior to maturity, you may receive more or less than your initial investment. Holding bonds to term allows redemption at par value. There is an inverse relationship between interest rate movements and bond prices. Generally, when interest rates rise, bond prices fall, and when interest rates fall, bond prices generally rise.
The Nasdaq 100 (^NDX) is a stock market index made up of 103 equity securities issued by 100 of the largest non-financial companies listed on the NASDAQ. It is a modified capitalization-weighted index. It is based on exchange, and it is not an index of U.S.-based companies.