


Morning Brief

Headline News:
The S&P 500 futures are up 61 points and are trading 1.7% above fair value. The Nasdaq 100 futures are up 228 points and are trading 2.1% above fair value. The Dow Jones Industrial Average futures are up 378 points and are trading 1.3% above fair value.
Equity futures are up sharply this morning as market participants look to build on yesterday’s gains, aided by contrarian-minded thinking that stems from an awareness that sentiment readings denote extremely bearish views.
There’s also growing excitement in the market about the Fed potentially slowing the pace of its rate hikes and potentially nearing the end of its rate hike cycle. That excitement has been stoked by the Reserve Bank of Australia (RBA), which raised its cash rate by only 25 basis points, instead of the 50 basis points expected, to 2.60%. The decision was tied to a recognition that the cash rate has increased substantially in a short period of time and a desire among RBA officials to see how the prior rate increases are affecting the outlook for inflation and economic growth.
The US dollar has weakened in the wake of the RBA move. The U.S. Dollar Index is down 0.5% to 111.19, with the euro (EUR/USD +0.6% to 0.9886) showing some strength against the greenback. Falling Treasury yields have been another supportive factor for equities.
The 2-yr note yield is down seven basis points to 4.03%, and the 10-yr note yield is down seven basis points to 3.58%. Gilt yields have also moved lower, driven by the news that Finance Minister Kwarteng will release his fiscal plan and forecasts from the OBR later this month instead of November 23, as previously indicated.
Energy complex futures trade in a mixed fashion. WTI crude oil futures are up 1.2% to $84.67/bbl and natural gas futures are down 0.3% to $6.46/mmbtu.
Separately, market participants will receive the August Factory Orders report (Briefing.com consensus +0.4%; prior -1.0%) and the August JOLTS Job Openings report (prior 11.239 million) at 10:00 a.m. ET.
(Michael Gibbs, Director of Equity Portfolio & Technical Strategy)
Markets:
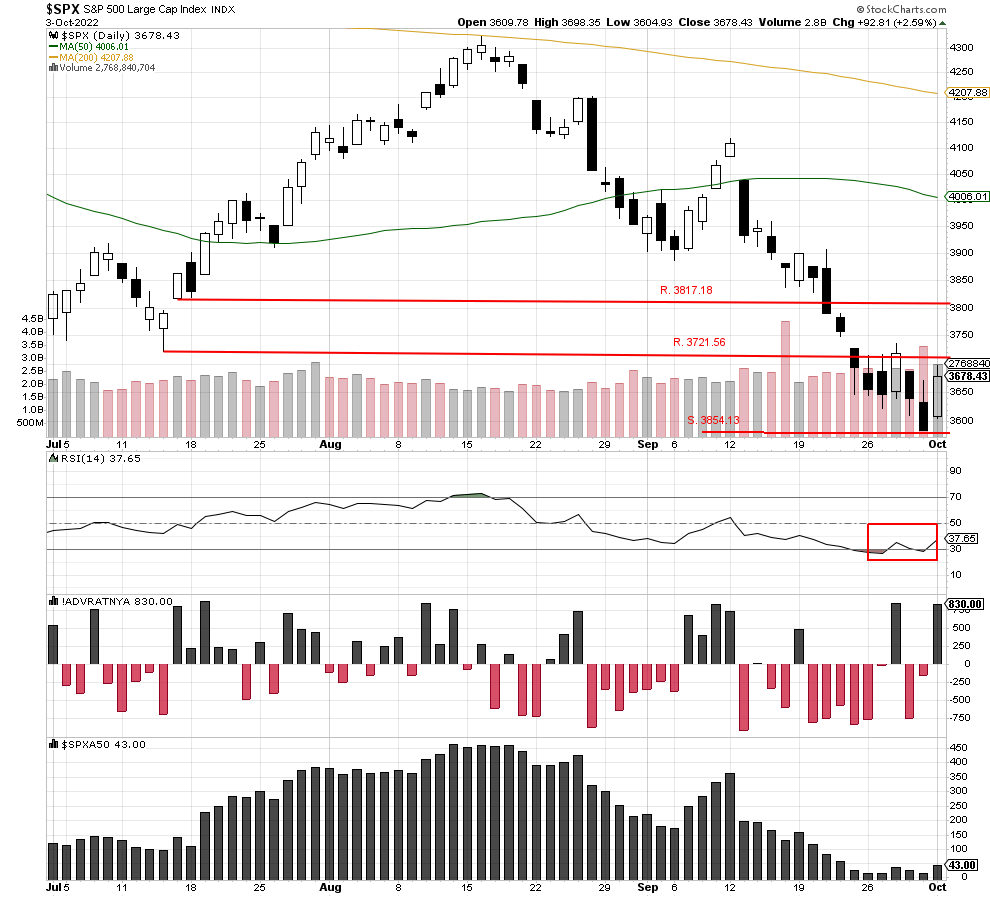
The S&P 500 rallied sharply off the year’s low at 3854.13 closing higher at 3978.43, and the index gained 2.59%, it’s most significant gain since 7/27/2022. Volume came in at 2,768,840,704, and 89% of that was up volume showing widespread buying. RSI also move higher in support of the rally closing at 37.65.
Potential resistance could now come in at 3721.56, and possible support may come in at the low of 3854.13. So far this morning, the S&P 500 futures are higher by 1.47%, with a suggested open of 3745.25. That would put the open above potential resistance and set up a possible follow-through day today with 80% or better up volume.
We are currently Intermediate-term bearish and short-term bearish.
John N. Lilly III CPFA
Accredited Portfolio Management Advisor℠
Accredited Asset Management Specialist℠
Portfolio Manager, RJFS
Partner, DJWMG
Windsor Wealth Planners & Strategist
The Relative Strength Index (RSI), developed by J. Welles Wilder, is a momentum oscillator that measures the speed and changes of price movements.
The advance/decline line (A/D) is a technical indicator that plots the difference between the number of advancing and declining stocks on a daily basis. The indicator is cumulative, with a positive number being added to the prior number, or if the number is negative, it is subtracted from the prior number.
The A/D line is used to show market sentiment, as it tells traders whether there are more stocks rising or falling. It is used to confirm price trends in major indexes and can also warn of reversals when divergence occurs.
The percentage of stocks trading above a specific moving average is a breadth indicator that measures internal strength or weakness in the underlying index. The 50-day moving average is used for short-to-medium-term timeframes, while the 150-day and 200-day moving averages are used for medium-to-long-term timeframes. Signals can be derived from overbought/oversold levels, crosses above/below 50%, and bullish/bearish divergences.
The Dow Jones Industrial Average (DJIA), commonly known as “The Dow,” is an index representing 30 stocks of companies maintained and reviewed by the editors of the Wall Street Journal. The Russell 2000 Index measures the performance of the 2,000 smallest companies in the Russell 3000 Index, which represent approximately 8% of the total market capitalization of the Russell 3000 Index.
The S&P 500 is an unmanaged index of 500 widely held stocks that is generally considered representative of the U.S stock market. Past performance may not be indicative of future results. Keep in mind that individuals cannot invest directly in any index, and index performance does not include transaction costs or other fees, which will affect actual investment performance. Individual investors’ results will vary. Opinions expressed are those of the author John N. Lilly III, and not necessarily those of Raymond James. “There is no guarantee that these statements, opinions, or forecast provided herein will prove to be correct. “The information contained was received from sources believed to be reliable, but accuracy is not guaranteed. Investing always involves risk, and you may incur a profit or loss. No investment strategy can guarantee success. The charts and/or tables presented herein are for illustrative purposes only and should not be considered as the sole basis for your investment decision. International investing involves special risks, including currency fluctuations, different financial accounting standards, and possible political and economic volatility. Investing in emerging markets can be riskier than investing in well-established foreign markets.
This is not a recommendation to buy or sell any company’s stock mentioned above.
US government bonds and treasury bills are guaranteed by the US government and, if held to maturity, offer a fixed rate of return and guaranteed principal value. US government bonds are issued and guaranteed as to the timely payment of principal and interest by the federal government. Bond prices and yields are subject to change based on market conditions and availability. If bonds are sold prior to maturity, you may receive more or less than your initial investment. Holding bonds to term allows redemption at par value. There is an inverse relationship between interest rate movements and bond prices. Generally, when interest rates rise, bond prices fall, and when interest rates fall, bond prices generally rise.
The Nasdaq 100 (^NDX) is a stock market index made up of 103 equity securities issued by 100 of the largest non-financial companies listed on the NASDAQ. It is a modified capitalization-weighted index. It is based on exchange, and it is not an index of U.S.-based companies.