


Morning Brief

Headline News:
The S&P 500 futures are up 29 points and are trading 0.7% above fair value. The Nasdaq 100 futures are up 120 points and are trading 0.9% above fair value. The Dow Jones Industrial Average futures are up 197 points and are trading 0.6% above fair value.
The equity futures market has a decidedly positive bias, with carryover momentum from recent gains driving the upside.
Other support factors include softer-than-expected CPI and PPI readings out of China, a weakening dollar, better-than-expected results and guidance from DocuSign (DOCU), and bearish investor sentiment readings that are acting as a contrarian catalyst.
The US Dollar Index is down 0.7% to 108.94. EUR/USD is up 0.6% to 1.0054. USD/JPY is down 1.1% to 142.55 after BOJ Governor Kuroda said rapid moves in the yen are not desirable. At the same time, cryptocurrencies are in rally mode with the risk-on sentiment.
The 2-yr Treasury note yield is flat at 3.49%, while the 10-yr note yield is down two basis points to 3.27%.
(Michael Gibbs, Director of Equity Portfolio & Technical Strategy)
Markets:
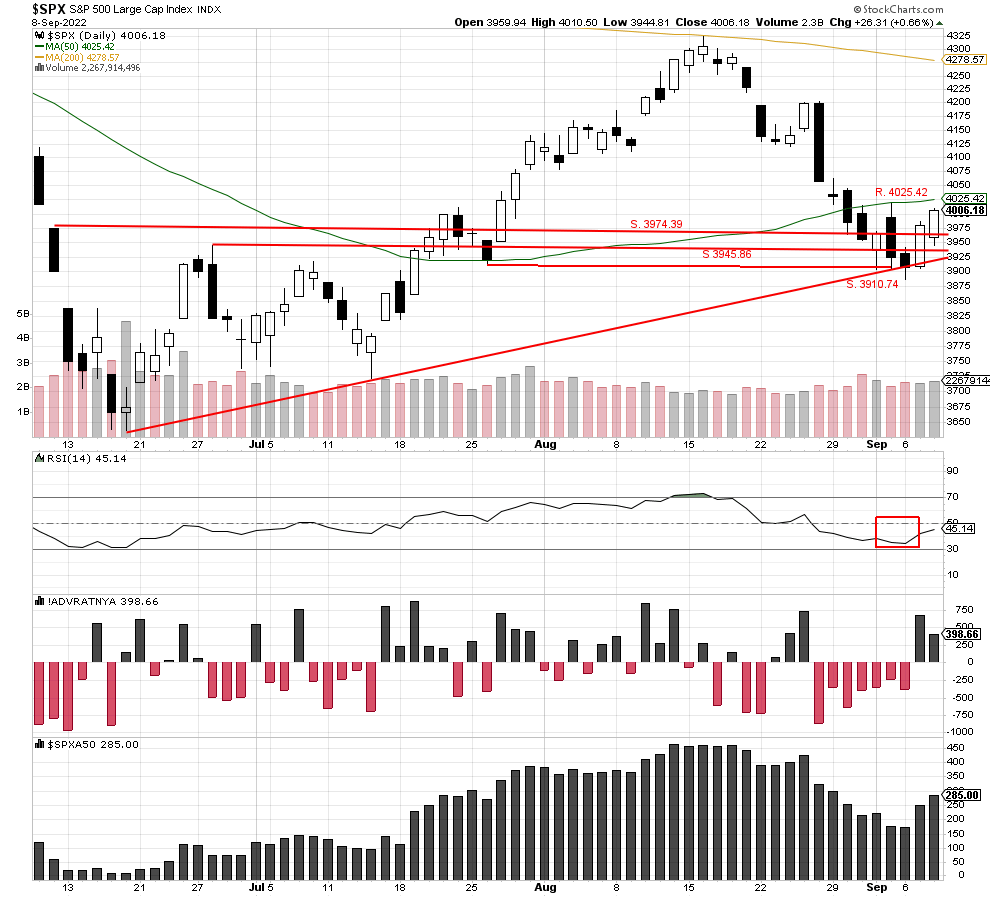
The S&P 500 rallied again, closing higher at 4006.18, and looks set to test the critical 50-day moving average. However, the rally did not come with an 80% up volume day like we had hoped for, with up volume only at 76%.
So far this morning, the index has a suggested open at 4040.75, which will be above the 50-day moving average. If that open holds, more buyers could come in today and potentially provide momentum to start a new uptrend.
We are currently Intermediate-term bearish and short-term bullish.
John N. Lilly III CPFA
Accredited Portfolio Management Advisor℠
Accredited Asset Management Specialist℠
Portfolio Manager, RJFS
Partner, DJWMG
Windsor Wealth Planners & Strategist
Futures trading is speculative, leveraged, and involves substantial risks. Investing always involves risk, including the loss of principal, and futures trading could present additional risk based on underlying commodities investments.
The Relative Strength Index (RSI), developed by J. Welles Wilder, is a momentum oscillator that measures the speed and changes of price movements.
The advance/decline line (A/D) is a technical indicator that plots the difference between the number of advancing and declining stocks on a daily basis. The indicator is cumulative, with a positive number being added to the prior number, or if the number is negative, it is subtracted from the prior number.
The A/D line is used to show market sentiment, as it tells traders whether there are more stocks rising or falling. It is used to confirm price trends in major indexes and can also warn of reversals when divergence occurs.
The percentage of stocks trading above a specific moving average is a breadth indicator that measures internal strength or weakness in the underlying index. The 50-day moving average is used for short-to-medium-term timeframes, while the 150-day and 200-day moving averages are used for medium-to-long-term timeframes. Signals can be derived from overbought/oversold levels, crosses above/below 50%, and bullish/bearish divergences.
The Dow Jones Industrial Average (DJIA), commonly known as “The Dow,” is an index representing 30 stocks of companies maintained and reviewed by the editors of the Wall Street Journal. The Russell 2000 Index measures the performance of the 2,000 smallest companies in the Russell 3000 Index, which represent approximately 8% of the total market capitalization of the Russell 3000 Index.
The S&P 500 is an unmanaged index of 500 widely held stocks that is generally considered representative of the U.S stock market. Past performance may not be indicative of future results. Keep in mind that individuals cannot invest directly in any index, and index performance does not include transaction costs or other fees, which will affect actual investment performance. Individual investors’ results will vary. Opinions expressed are those of the author John N. Lilly III, and not necessarily those of Raymond James. “There is no guarantee that these statements, opinions, or forecast provided herein will prove to be correct. “The information contained was received from sources believed to be reliable, but accuracy is not guaranteed. Investing always involves risk, and you may incur a profit or loss. No investment strategy can guarantee success. The charts and/or tables presented herein are for illustrative purposes only and should not be considered as the sole basis for your investment decision. International investing involves special risks, including currency fluctuations, different financial accounting standards, and possible political and economic volatility. Investing in emerging markets can be riskier than investing in well-established foreign markets.
This is not a recommendation to buy or sell any company’s stock mentioned above.
US government bonds and treasury bills are guaranteed by the US government and, if held to maturity, offer a fixed rate of return and guaranteed principal value. US government bonds are issued and guaranteed as to the timely payment of principal and interest by the federal government. Bond prices and yields are subject to change based on market conditions and availability. If bonds are sold prior to maturity, you may receive more or less than your initial investment. Holding bonds to term allows redemption at par value. There is an inverse relationship between interest rate movements and bond prices. Generally, when interest rates rise, bond prices fall, and when interest rates fall, bond prices generally rise.
The Nasdaq 100 (^NDX) is a stock market index made up of 103 equity securities issued by 100 of the largest non-financial companies listed on the NASDAQ. It is a modified capitalization-weighted index. It is based on exchange, and it is not an index of U.S.-based companies.