


Morning Brief

Headline News:
The S&P 500 futures are up 26 points and are trading 0.6% above fair value. The Nasdaq 100 futures are up 108 points and are trading 0.8% above fair value. The Dow Jones Industrial Average futures are up 176 points and are trading 0.6% above fair value.
Equity futures indicate a higher open in a reflective rebound following losses in the last two sessions.
Bloomberg is reporting that the EU is set to meet its gas storage filling goal two months ahead of target. European Commission President von der Leyen said that an emergency intervention is being planned to rein in energy prices.
Energy complex futures are trending lower amid the aforementioned macro headlines, as well as an understanding that Shenzhen is imposing COVID restrictions. WTI crude oil futures are down 3.0% to $94.03/bbl. Natural gas futures are down 1.1% to $9.23/mmbtu. Unleaded gasoline futures are down 3.6% to $2.61/gal.
Treasury yields are drifting lower. The 2-yr note yield is down one basis point to 3.42%, while the 10-yr note yield is down four basis points to 3.06%.
Market participants will receive the June FHFA Housing Price Index (prior 1.4%) and June S&P Case-Shiller Home Price Index (Briefing.com consensus 19.0%; prior 20.5%) at 9:00 a.m. ET. The August Consumer Confidence reading (Briefing.com consensus 97.4; prior 95.7) and July JOLTS Job Openings (prior 10.698 million) at 10:00 a.m. ET.
(Michael Gibbs, Director of Equity Portfolio & Technical Strategy)
Markets:
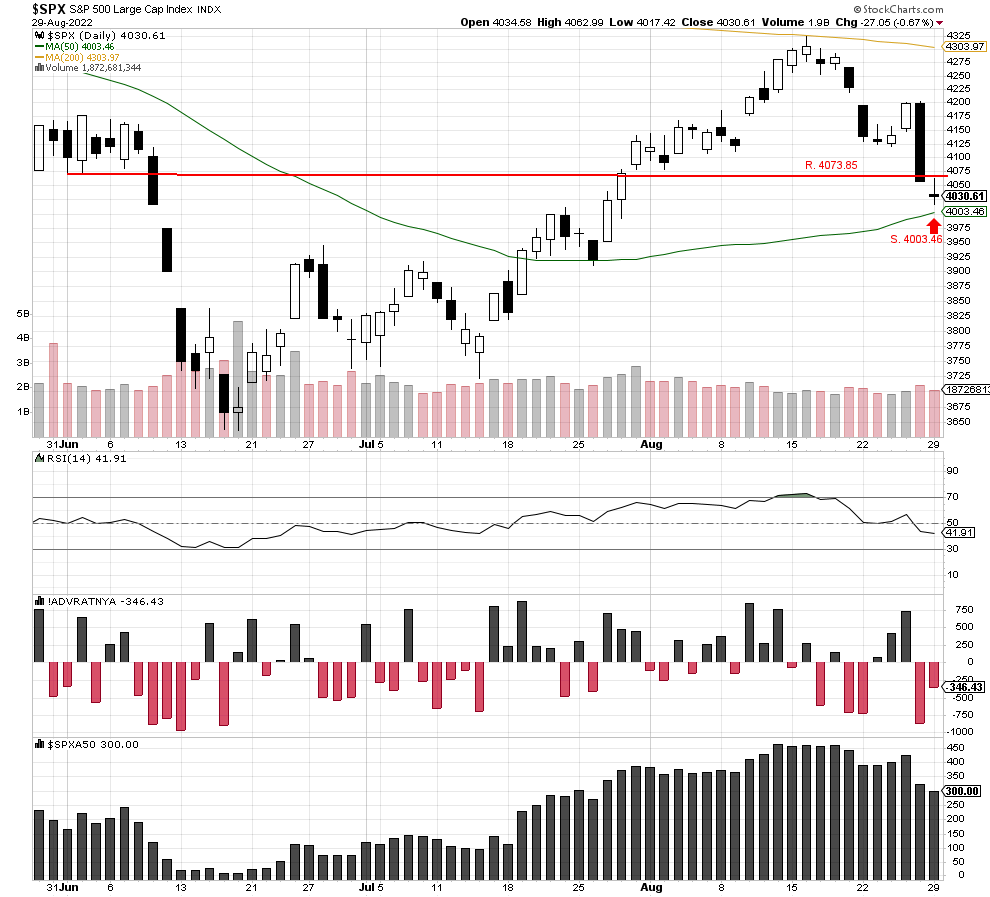
The S&P 500 sold off early in the day, rallied late, but closed lower at 4030.61. The day’s trading did not provide a follow-through day after Friday’s massive sell-off, which is a good sign that the worst selling is potentially over. The index tested resistance at 4073.85 and failed, so we know sellers are lurking at that level. If the index can close above that level, the sellers could take over and restart the uptrend. If not possible, support remains at the 50-day moving average at 4003.46, and we believe that level will hold if tested.
We are currently Intermediate-term bearish and short-term bullish.
John N. Lilly III CPFA
Accredited Portfolio Management Advisor℠
Accredited Asset Management Specialist℠
Portfolio Manager, RJFS
Partner, DJWMG
Windsor Wealth Planners & Strategist
Futures trading is speculative, leveraged, and involves substantial risks. Investing always involves risk, including the loss of principal, and futures trading could present additional risk based on underlying commodities investments.
The Relative Strength Index (RSI), developed by J. Welles Wilder, is a momentum oscillator that measures the speed and changes of price movements.
The advance/decline line (A/D) is a technical indicator that plots the difference between the number of advancing and declining stocks on a daily basis. The indicator is cumulative, with a positive number being added to the prior number, or if the number is negative, it is subtracted from the prior number.
The A/D line is used to show market sentiment, as it tells traders whether there are more stocks rising or falling. It is used to confirm price trends in major indexes and can also warn of reversals when divergence occurs.
The percentage of stocks trading above a specific moving average is a breadth indicator that measures internal strength or weakness in the underlying index. The 50-day moving average is used for short-to-medium-term timeframes, while the 150-day and 200-day moving averages are used for medium-to-long-term timeframes. Signals can be derived from overbought/oversold levels, crosses above/below 50%, and bullish/bearish divergences.
The Dow Jones Industrial Average (DJIA), commonly known as “The Dow,” is an index representing 30 stocks of companies maintained and reviewed by the editors of the Wall Street Journal. The Russell 2000 Index measures the performance of the 2,000 smallest companies in the Russell 3000 Index, which represent approximately 8% of the total market capitalization of the Russell 3000 Index.
The S&P 500 is an unmanaged index of 500 widely held stocks that is generally considered representative of the U.S stock market. Past performance may not be indicative of future results. Keep in mind that individuals cannot invest directly in any index, and index performance does not include transaction costs or other fees, which will affect actual investment performance. Individual investors’ results will vary. Opinions expressed are those of the author John N. Lilly III, and not necessarily those of Raymond James. “There is no guarantee that these statements, opinions, or forecast provided herein will prove to be correct. “The information contained was received from sources believed to be reliable, but accuracy is not guaranteed. Investing always involves risk, and you may incur a profit or loss. No investment strategy can guarantee success. The charts and/or tables presented herein are for illustrative purposes only and should not be considered as the sole basis for your investment decision. International investing involves special risks, including currency fluctuations, different financial accounting standards, and possible political and economic volatility. Investing in emerging markets can be riskier than investing in well-established foreign markets.
This is not a recommendation to buy or sell any company’s stock mentioned above.
US government bonds and treasury bills are guaranteed by the US government and, if held to maturity, offer a fixed rate of return and guaranteed principal value. US government bonds are issued and guaranteed as to the timely payment of principal and interest by the federal government. Bond prices and yields are subject to change based on market conditions and availability. If bonds are sold prior to maturity, you may receive more or less than your initial investment. Holding bonds to term allows redemption at par value. There is an inverse relationship between interest rate movements and bond prices. Generally, when interest rates rise, bond prices fall, and when interest rates fall, bond prices generally rise.
The Nasdaq 100 (^NDX) is a stock market index made up of 103 equity securities issued by 100 of the largest non-financial companies listed on the NASDAQ. It is a modified capitalization-weighted index. It is based on exchange, and it is not an index of U.S.-based companies.