


Morning Brief

Headline News:
The S&P 500 futures are up 21 points and are trading 0.5% above fair value. The Nasdaq 100 futures are up 64 points and are trading 0.4% above fair value. The Dow Jones Industrial Average futures are up 144 points and are trading 0.6% above fair value.
Futures for the major indices are trading higher with a measure of relief that China’s response to Speaker Pelosi’s Taiwan visit was not more consequential. Attention has also shifted to earnings news which is generally better-than-feared.
In other news, St. Louis Fed President Bullard (FOMC voter) said after yesterday’s close that he thinks a soft landing is possible, but the Fed will need to keep raising interest rates. He thinks the target range should be 3.75%-4.00% by the end of the year.
Also, OPEC+ is meeting today, and there has been speculation that it will increase its production quota.
Oil prices are moving higher this morning. WTI crude oil futures are up 0.6% to $95.00/bbl. Unleaded gasoline futures are up 1.6% to $3.11/gal. Natural gas futures are up 1.0% to $7.78.
Treasury yields are rising. The 2-yr note yield is up two basis points to 3.09%, while the 10-yr note yield is up three basis points to 2.78%.
There are several economic data releases this morning, with the focal point being the July ISM Non-Manufacturing Index (Briefing.com consensus 53.8%; prior 55.3%) at 10:00 a.m. ET.
(Michael Gibbs, Director of Equity Portfolio & Technical Strategy)
Markets:
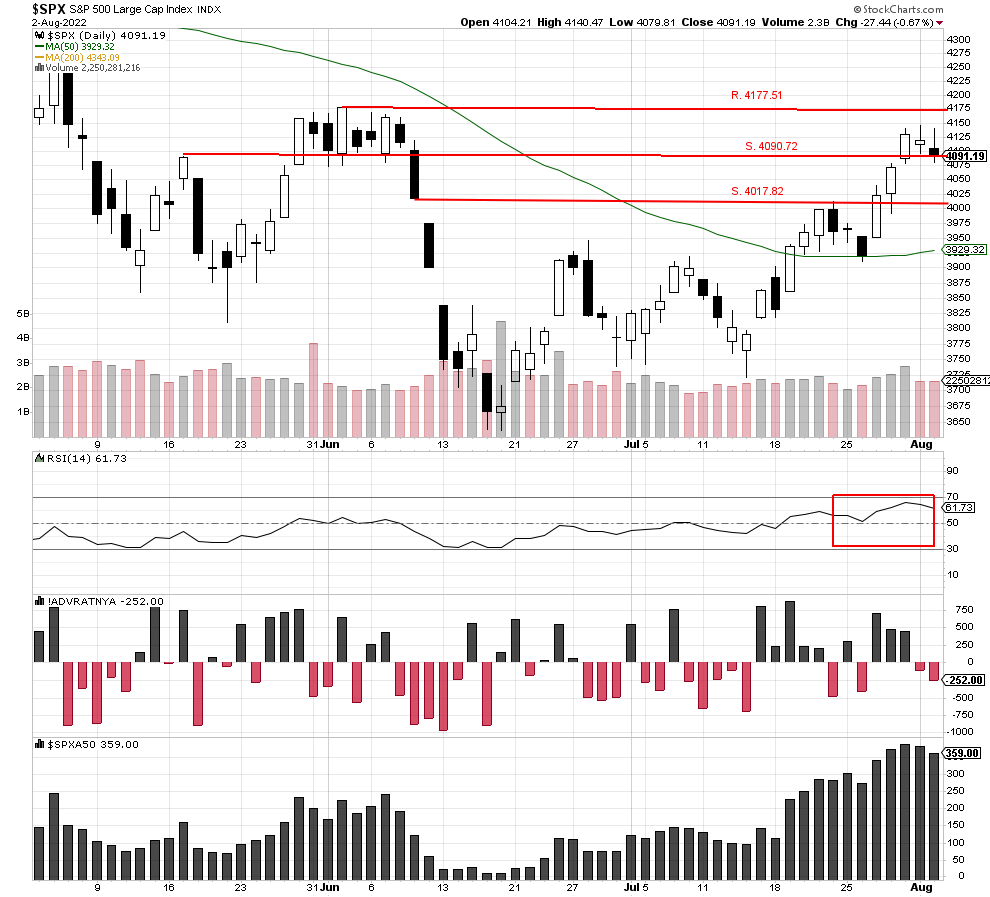
The S&P 500 closed lower at 4091.19 with below-average volume of 2,250,281,216. RSI also moved lower and closed at 61.73, which still supports the recent uptrend. The trading did little to resolve the oversold conditions of the market internals, so caution is still warranted.
The index is just above potential support at 4090.72, and we feel that level could be breached soon. If so, the next possible support level is at 4017.82; if that level is tested, we believe it will hold. The best bullish case is still a base at these levels with below-average volume.
We are currently Intermediate-term bearish and short-term bullish.
John N. Lilly III CPFA
Accredited Portfolio Management Advisor℠
Accredited Asset Management Specialist℠
Portfolio Manager, RJFS
Partner, DJWMG
Windsor Wealth Planners & Strategist
Futures trading is speculative, leveraged, and involves substantial risks. Investing always involves risk, including the loss of principal, and futures trading could present additional risk based on underlying commodities investments.
The Relative Strength Index (RSI), developed by J. Welles Wilder, is a momentum oscillator that measures the speed and changes of price movements.
The advance/decline line (A/D) is a technical indicator that plots the difference between the number of advancing and declining stocks on a daily basis. The indicator is cumulative, with a positive number being added to the prior number, or if the number is negative, it is subtracted from the prior number.
The A/D line is used to show market sentiment, as it tells traders whether there are more stocks rising or falling. It is used to confirm price trends in major indexes and can also warn of reversals when divergence occurs.
The percentage of stocks trading above a specific moving average is a breadth indicator that measures internal strength or weakness in the underlying index. The 50-day moving average is used for short-to-medium-term timeframes, while the 150-day and 200-day moving averages are used for medium-to-long-term timeframes. Signals can be derived from overbought/oversold levels, crosses above/below 50%, and bullish/bearish divergences.
The Dow Jones Industrial Average (DJIA), commonly known as “The Dow,” is an index representing 30 stocks of companies maintained and reviewed by the editors of the Wall Street Journal. The Russell 2000 Index measures the performance of the 2,000 smallest companies in the Russell 3000 Index, which represent approximately 8% of the total market capitalization of the Russell 3000 Index.
The S&P 500 is an unmanaged index of 500 widely held stocks that is generally considered representative of the U.S stock market. Past performance may not be indicative of future results. Keep in mind that individuals cannot invest directly in any index, and index performance does not include transaction costs or other fees, which will affect actual investment performance. Individual investors’ results will vary. Opinions expressed are those of the author John N. Lilly III, and not necessarily those of Raymond James. “There is no guarantee that these statements, opinions, or forecast provided herein will prove to be correct. “The information contained was received from sources believed to be reliable, but accuracy is not guaranteed. Investing always involves risk, and you may incur a profit or loss. No investment strategy can guarantee success. The charts and/or tables presented herein are for illustrative purposes only and should not be considered as the sole basis for your investment decision. International investing involves special risks, including currency fluctuations, different financial accounting standards, and possible political and economic volatility. Investing in emerging markets can be riskier than investing in well-established foreign markets.
This is not a recommendation to buy or sell any company’s stock mentioned above.
US government bonds and treasury bills are guaranteed by the US government and, if held to maturity, offer a fixed rate of return and guaranteed principal value. US government bonds are issued and guaranteed as to the timely payment of principal and interest by the federal government. Bond prices and yields are subject to change based on market conditions and availability. If bonds are sold prior to maturity, you may receive more or less than your initial investment. Holding bonds to term allows redemption at par value. There is an inverse relationship between interest rate movements and bond prices. Generally, when interest rates rise, bond prices fall, and when interest rates fall, bond prices generally rise.