


Morning Brief

Headline News:
The S&P 500 futures are up 17 points and are trading 0.4% above fair value. The Nasdaq 100 futures are up 50 points and are trading 0.2% above fair value. The Dow Jones Industrial Average futures are up 152 points and are trading 0.6% above fair value.
There are not a lot of big corporate headlines in play this morning ahead of a busy week for market-moving catalysts. Futures for the major indices are trading up on a general feeling that the Fed is getting closer to becoming less aggressive with rate hikes. Also, a feeling that inflation is at its peak and due to moderate remains in play.
Some weekend developments included Treasury Secretary Yellen downplaying the idea of the U.S. being in recession, Russia bombing the Odessa port that facilitates grain shipments, and Reuters reporting that China is aiming to put together a property developer bailout fund of up to $44 billion.
This week is full of market-moving catalysts, namely earnings reports from approximately 175 S&P 500 companies which make up nearly 50% of the index’s market cap, the FOMC decision on Wednesday, the advanced Q2 GDP reading, and the June Personal Income and Spending report on Friday. Separately, the Senate is expected to hold a final vote on the CHIPS act semiconductor manufacturing bill on Tuesday.
Energy complex futures are on the rise. WTI crude oil futures are up 1.1% to $95.76.bbl. Unleaded gasoline futures are up 1.2% to $3.06/gal. Natural gas futures are up 1.0% to $8.27/mmbtu.
Treasury yields have risen some, too. The 2-yr note yield is up two basis points to 3.01%, while the 10-yr note yield is up three basis points to 2.81%.
The 2-yr Treasury note yield is down nine basis points to 3.00%, and the 10-yr note yield is down 11 basis points to 2.80%.
(Michael Gibbs, Director of Equity Portfolio & Technical Strategy)
Markets:
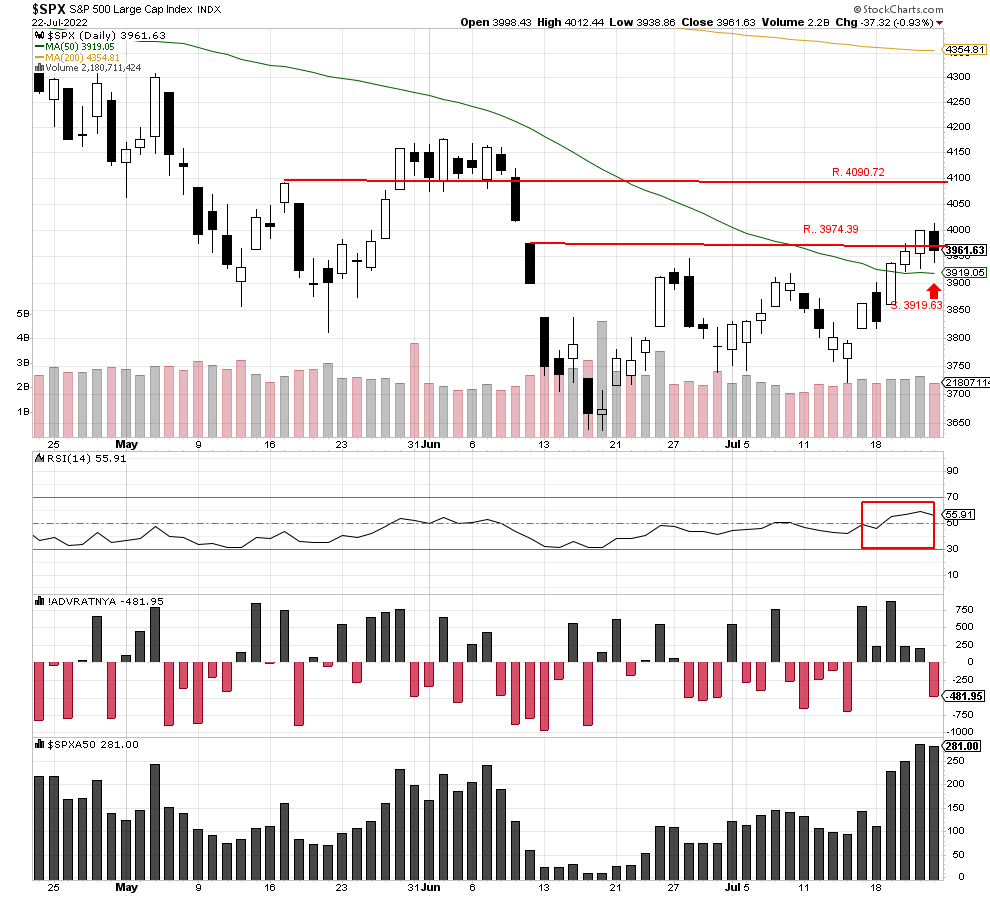
The S&P 500 opened higher on Friday and came close to filling the gap at 4017.17 but sold off late to close lower at 3961.63. The index is now under potential resistance at 3974.39, and possible support remains at the 50-day moving average at 3919.63. RSI remained above 50, showing investors are still supporting the recent uptrend.
This week could be slow as we await the Federal Reserve announcement on interest rates at the Wednesday meeting. However, corporate earnings reports could be a market mover ahead of the meeting.
We are currently Intermediate-term bearish and short-term bearish.
John N. Lilly III CPFA
Accredited Portfolio Management Advisor℠
Accredited Asset Management Specialist℠
Portfolio Manager, RJFS
Partner, DJWMG
Windsor Wealth Planners & Strategist
Futures trading is speculative, leveraged, and involves substantial risks. Investing always involves risk, including the loss of principal, and futures trading could present additional risk based on underlying commodities investments.
The Relative Strength Index (RSI), developed by J. Welles Wilder, is a momentum oscillator that measures the speed and changes of price movements.
The advance/decline line (A/D) is a technical indicator that plots the difference between the number of advancing and declining stocks on a daily basis. The indicator is cumulative, with a positive number being added to the prior number, or if the number is negative it is subtracted from the prior number.
The A/D line is used to show market sentiment, as it tells traders whether there are more stocks rising or falling. It is used to confirm price trends in major indexes, and can also warn of reversals when divergence occurs.
The percentage of stocks trading above a specific moving average is a breadth indicator that measures internal strength or weakness in the underlying index. The 50-day moving average is used for short-to-medium-term timeframes, while the 150-day and 200-day moving averages are used for medium-to-long-term timeframes. Signals can be derived from overbought/oversold levels, crosses above/below 50% and bullish/bearish divergences.
The Dow Jones Industrial Average (DJIA), commonly known as “The Dow” is an index representing 30 stock of companies maintained and reviewed by the editors of the Wall Street Journal. The Russell 2000 Index measures the performance of the 2,000 smallest companies in the Russell 3000 Index, which represent approximately 8% of the total market capitalization of the Russell 3000 Index.
The S&P 500 is an unmanaged index of 500 widely held stocks that is generally considered representative of the U.S stock market. Past performance may not be indicative of future results. Keep in mind that individuals cannot invest directly in any index, and index performance does not include transaction costs or other fees, which will affect actual investment performance. Individual investors’ results will vary. Opinions expressed are those of the author John N. Lilly III, and not necessarily those of Raymond James. “There is no guarantee that these statements, opinions, or forecast provided herein will prove to be correct. “The information contained was received from sources believed to be reliable, but accuracy is not guaranteed. Investing always involves risk, and you may incur a profit or loss. No investment strategy can guarantee success. The charts and/or tables presented herein are for illustrative purposes only and should not be considered as the sole basis for your investment decision. International investing involves special risks, including currency fluctuations, different financial accounting standards, and possible political and economic volatility. Investing in emerging markets can be riskier than investing in well-established foreign markets.
This is not a recommendation to buy or sell any company’s stock mentioned above.
US government bonds and treasury bills are guaranteed by the US government and, if held to maturity, offer a fixed rate of return and guaranteed principal value. US government bonds are issued and guaranteed as to the timely payment of principal and interest by the federal government. Bond prices and yields are subject to change based upon market conditions and availability. If bonds are sold prior to maturity, you may receive more or less than your initial investment. Holding bonds to term allows redemption at par value. There is an inverse relationship between interest rate movements and bond prices. Generally, when interest rates rise, bond prices fall and when interest rates fall, bond prices generally rise.