


Morning Brief

Headline News:
The S&P 500 futures are down 17 points and are trading 0.4% below fair value. The Nasdaq 100 futures are down 58 points and are trading 0.5% below fair value. The Dow Jones Industrial Average futures are down 99 points and are trading 0.3% below fair value.
The 2s10s spread remains inverted. The 2-yr note yield is flat at 2.82% while the 10-yr note yield is down one basis point to 2.80%.
Shanghai reported the highest number of new COVID cases in three weeks, raising the potential for renewed lockdown measures.
In other overseas news, Norwegian oil and gas workers will return to work after an imposition of forced settlements by the government.
The energy futures are rising this morning after being hit hard yesterday. WTI crude oil futures are up 0.7% to $100.16/bbl. Natural gas futures are up 2.3% to $5.62/mmbtu. Unleaded gasoline futures are up 0.8% to $3.35/gal.
On a related note, the OPEC Secretary-General, Mohammad Barkindo, unexpectedly passed away last night just three weeks shy of the end of his second term.
Separately, cryptocurrency lender Voyager Digital has filed for bankruptcy after Three Arrows Capital failed to pay back a $650 million loan.
Looking ahead, market participants will receive the ISM Non-Manufacturing Index for June (Briefing.com consensus 54.2%; prior 55.9%) at 10:00 a.m. ET and the FOMC Minutes from the last meeting at 2:00 p.m. ET.
(Michael Gibbs, Director of Equity Portfolio & Technical Strategy)
Markets:
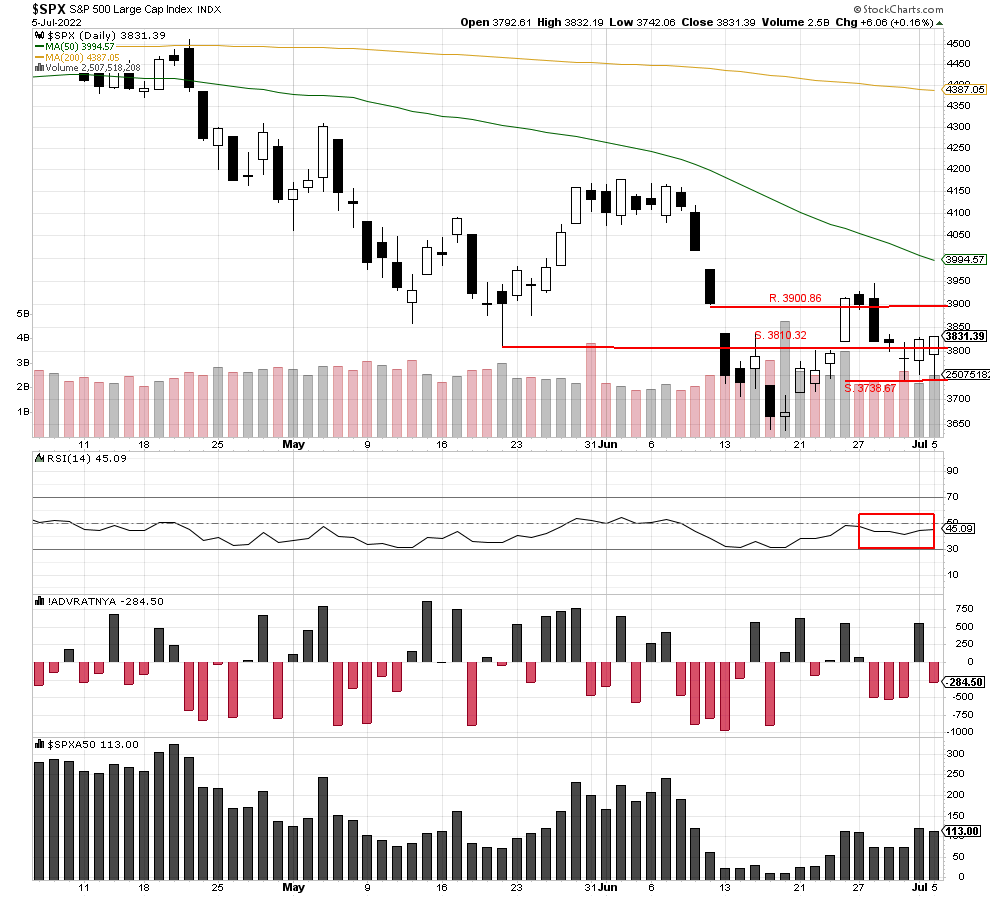
The S&P 500 rallied late in the day to move past resistance at 3810.32 and closed higher at 3831.39. The rally came with only average volume of 2,507,518,208, and RSI failed to move past the 50 level in support. The index has tested the 3738.67 support level three times now, so we know there are buyers at that level, and if that should be breached, the index could test the lows again. However, the rally yesterday was impressive because the sellers were in control all-day trying to move the index lower. We feel the trading will be subdued until Friday’s June Non-Farm Payrolls report release.
We are currently Intermediate-term bearish and short-term bearish.
John N. Lilly III CPFA
Accredited Portfolio Management Advisor℠
Accredited Asset Management Specialist℠
Portfolio Manager, RJFS
Partner, DJWMG
Windsor Wealth Planners & Strategist
Futures trading is speculative, leveraged, and involves substantial risks. Investing always involves risk, including the loss of principal, and futures trading could present additional risk based on underlying commodities investments.
The Relative Strength Index (RSI), developed by J. Welles Wilder, is a momentum oscillator that measures the speed and changes of price movements.
The advance/decline line (A/D) is a technical indicator that plots the difference between the number of advancing and declining stocks on a daily basis. The indicator is cumulative, with a positive number being added to the prior number, or if the number is negative it is subtracted from the prior number.
The A/D line is used to show market sentiment, as it tells traders whether there are more stocks rising or falling. It is used to confirm price trends in major indexes, and can also warn of reversals when divergence occurs.
The percentage of stocks trading above a specific moving average is a breadth indicator that measures internal strength or weakness in the underlying index. The 50-day moving average is used for short-to-medium-term timeframes, while the 150-day and 200-day moving averages are used for medium-to-long-term timeframes. Signals can be derived from overbought/oversold levels, crosses above/below 50% and bullish/bearish divergences.
The Dow Jones Industrial Average (DJIA), commonly known as “The Dow” is an index representing 30 stock of companies maintained and reviewed by the editors of the Wall Street Journal. The Russell 2000 Index measures the performance of the 2,000 smallest companies in the Russell 3000 Index, which represent approximately 8% of the total market capitalization of the Russell 3000 Index.
The S&P 500 is an unmanaged index of 500 widely held stocks that is generally considered representative of the U.S stock market. Past performance may not be indicative of future results. Keep in mind that individuals cannot invest directly in any index, and index performance does not include transaction costs or other fees, which will affect actual investment performance. Individual investors’ results will vary. Opinions expressed are those of the author John N. Lilly III, and not necessarily those of Raymond James. “There is no guarantee that these statements, opinions, or forecast provided herein will prove to be correct. “The information contained was received from sources believed to be reliable, but accuracy is not guaranteed. Investing always involves risk, and you may incur a profit or loss. No investment strategy can guarantee success. The charts and/or tables presented herein are for illustrative purposes only and should not be considered as the sole basis for your investment decision. International investing involves special risks, including currency fluctuations, different financial accounting standards, and possible political and economic volatility. Investing in emerging markets can be riskier than investing in well-established foreign markets.
This is not a recommendation to buy or sell any company’s stock mentioned above.
US government bonds and treasury bills are guaranteed by the US government and, if held to maturity, offer a fixed rate of return and guaranteed principal value. US government bonds are issued and guaranteed as to the timely payment of principal and interest by the federal government. Bond prices and yields are subject to change based upon market conditions and availability. If bonds are sold prior to maturity, you may receive more or less than your initial investment. Holding bonds to term allows redemption at par value. There is an inverse relationship between interest rate movements and bond prices. Generally, when interest rates rise, bond prices fall and when interest rates fall, bond prices generally rise.