


Morning Brief

Headline News:
The S&P 500 futures trade 26 points, or 0.7%, below fair value in a carryover of selling momentum, particularly in the mega-cap stocks. The tech-heavy Nasdaq 100 futures underperform and trade 1.0% below fair value.
The futures market continues to grapple with growth concerns attributed in part to the Fed’s aggressive tightening plans in the face of slowing economic growth and high inflation. After a relatively disappointing April CPI report yesterday, investors will see what producer inflation was in April.
Specifically, the Producer Price Index for April (Briefing.com consensus 0.5%) will be released at 8:30 a.m. ET alongside the weekly Initial Claims (Briefing.com consensus 191,000) and Continuing Claims report.
There is renewed hope that inflation rates could be peaking, which could be driving another eight-basis-point decline in the 10-yr yield to 2.84%. At the same time, though, growth concerns and some safe-haven positioning could be in the mix, too.
The 2-yr yield is down five basis points to 2.59%. The U.S. Dollar Index is up 0.6% to 104.44. WTI crude futures are down 1.4%, or $1.50, to $104.21/bbl.
Separately, shares of Walt Disney (DIS 100.85, -4.36, -4.1%) are down 4% in pre-market action after the Dow component missed top and bottom-line estimates and reaffirmed expectations of reaching 230-260 million Disney+ subscribers by FY24.
(Michael Gibbs, Director of Equity Portfolio & Technical Strategy)
Markets:
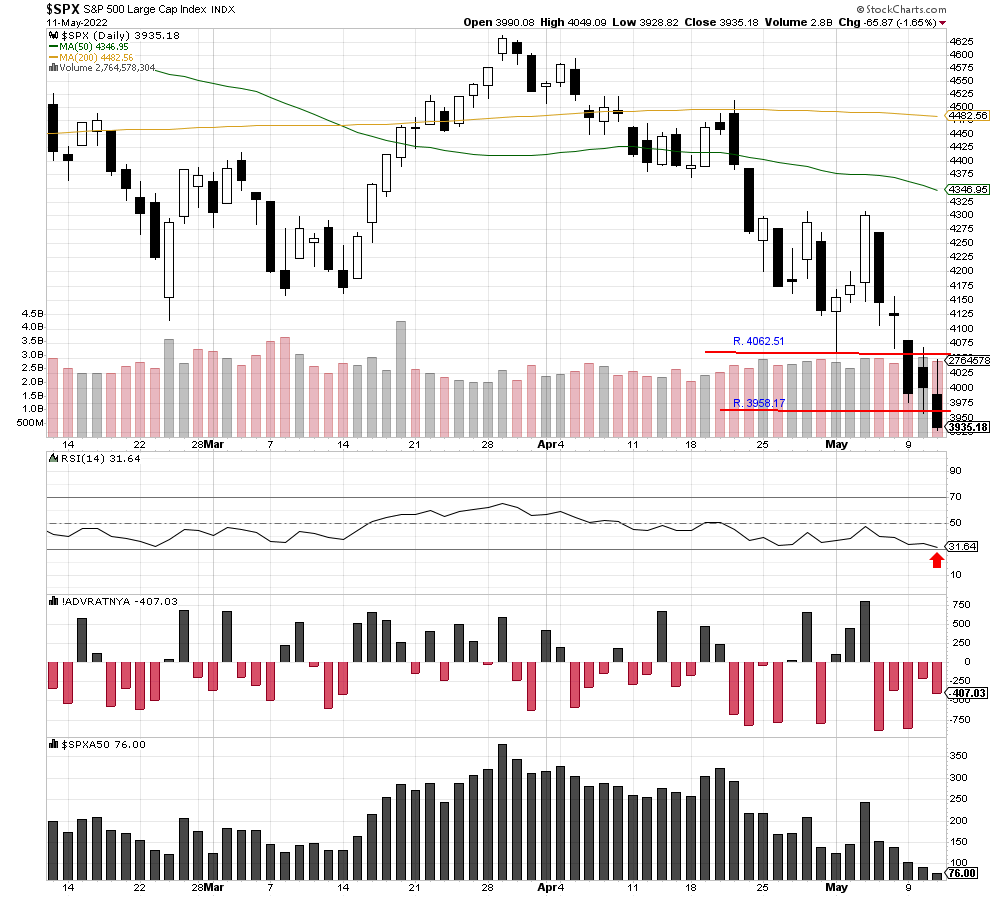
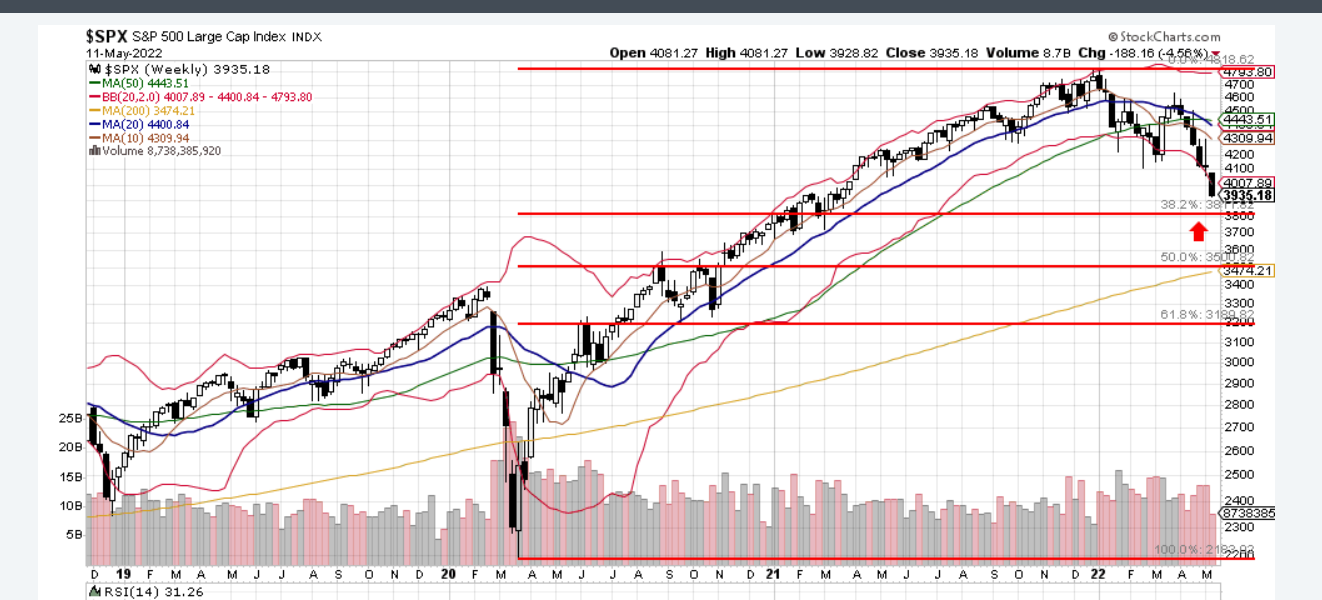
The S&P 500 closed lower at 3935.18 and broke the support level at 3958.17. The trading came with lower volume of 2,764,578,304, and RSI is now close to moving into the oversold level, closing at 31.64. Potential support could now come in at 3781.15 at the 38% Fibonacci level, and we feel that level will be tested soon. So far this morning, the index is set to open near the 3,900 level, and it appears the selling could continue today. If so, a 90% downside volume day and RSI moving into the oversold level would be a good sign of a potential bottom.
We are currently Intermediate-term bearish and short-term bearish.
John N. Lilly III CPFA
Accredited Portfolio Management Advisor℠
Accredited Asset Management Specialist℠
Portfolio Manager, RJFS
Partner, DJWMG
Windsor Wealth Planners & Strategist
Futures trading is speculative, leveraged, and involves substantial risks. Investing always involves risk, including the loss of principal, and futures trading could present additional risk based on underlying commodities investments.
The Relative Strength Index (RSI), developed by J. Welles Wilder, is a momentum oscillator that measures the speed and changes of price movements.
The advance/decline line (A/D) is a technical indicator that plots the difference between the number of advancing and declining stocks on a daily basis. The indicator is cumulative, with a positive number being added to the prior number, or if the number is negative it is subtracted from the prior number.
The A/D line is used to show market sentiment, as it tells traders whether there are more stocks rising or falling. It is used to confirm price trends in major indexes, and can also warn of reversals when divergence occurs.
The percentage of stocks trading above a specific moving average is a breadth indicator that measures internal strength or weakness in the underlying index. The 50-day moving average is used for short-to-medium-term timeframes, while the 150-day and 200-day moving averages are used for medium-to-long-term timeframes. Signals can be derived from overbought/oversold levels, crosses above/below 50% and bullish/bearish divergences.
The Dow Jones Industrial Average (DJIA), commonly known as “The Dow” is an index representing 30 stock of companies maintained and reviewed by the editors of the Wall Street Journal. The Russell 2000 Index measures the performance of the 2,000 smallest companies in the Russell 3000 Index, which represent approximately 8% of the total market capitalization of the Russell 3000 Index.
The S&P 500 is an unmanaged index of 500 widely held stocks that is generally considered representative of the U.S stock market. Past performance may not be indicative of future results. Keep in mind that individuals cannot invest directly in any index, and index performance does not include transaction costs or other fees, which will affect actual investment performance. Individual investors’ results will vary. Opinions expressed are those of the author John N. Lilly III, and not necessarily those of Raymond James. “There is no guarantee that these statements, opinions, or forecast provided herein will prove to be correct. “The information contained was received from sources believed to be reliable, but accuracy is not guaranteed. Investing always involves risk, and you may incur a profit or loss. No investment strategy can guarantee success. The charts and/or tables presented herein are for illustrative purposes only and should not be considered as the sole basis for your investment decision. International investing involves special risks, including currency fluctuations, different financial accounting standards, and possible political and economic volatility. Investing in emerging markets can be riskier than investing in well-established foreign markets.
This is not a recommendation to buy or sell any company’s stock mentioned above.
US government bonds and treasury bills are guaranteed by the US government and, if held to maturity, offer a fixed rate of return and guaranteed principal value. US government bonds are issued and guaranteed as to the timely payment of principal and interest by the federal government. Bond prices and yields are subject to change based upon market conditions and availability. If bonds are sold prior to maturity, you may receive more or less than your initial investment. Holding bonds to term allows redemption at par value. There is an inverse relationship between interest rate movements and bond prices. Generally, when interest rates rise, bond prices fall and when interest rates fall, bond prices generally rise.
Fibonacci retracement levels—stemming from the Fibonacci sequence—are horizontal lines that indicate where support and resistance are likely to occur.
Each level is associated with a percentage. The percentage is how much of a prior move the price has retraced. The Fibonacci retracement levels are 23.6%, 38.2%, 61.8%, and 78.6%. While not officially a Fibonacci ratio, 50% is also used.
The indicator is useful because it can be drawn between any two significant price points, such as a high and a low. The indicator will then create the levels between those two points.