


Morning Brief

Headline News:
The S&P 500 futures trade 38 points, or 0.9%, below fair value as discouraging outlooks from Apple (AAPL 159.50, -4.14, -2.5%) and Amazon.com (AMZN 2617.40, -274.53, -9.7%) set the negative tone in the futures market.
Apple’s quarterly results were better than expected, but the stock’s 2.5% decline is rooted in a warning that the impact from supply chain issues will be $4-8 billion in fiscal Q3, which is “substantially larger” than what it experienced during fiscal Q2. Amazon is down about 10% after guiding Q2 revenue and operating income below expectations.
Intel (INTC 44.88, -1.96, -4.2%) and Chevron (CVX 159.46, -2.33, -1.4%) are also trading lower after the former issued downside Q2 guidance and the latter missed earnings expectations. Honeywell (HON 193.30, +3.38, +1.8%), however, is a notable earnings standout.
At 8:30 a.m. ET, investors will receive another inflation update with the inclusion of PCE Prices in the Personal Income (Briefing.com consensus 0.4%) and Spending (Briefing.com consensus 0.6%) report for March and the release of the Q1 Employment Cost Index (Briefing.com consensus 1.1%).
Afterwards, the Chicago PMI for April (Briefing.com consensus 62.0) will be available at 9:45 a.m. ET, followed by the final University of Michigan Index of Consumer Sentiment for April (Briefing.com consensus 65.7) at 10:00 a.m. ET.
Elsewhere, the 2-yr Treasury note yield is up four basis points to 2.68% while the 10-yr yield remains unchanged at 2.86%. The U.S. Dollar Index is down 0.6% to 102.97. WTI crude futures are up 1.0%, or $1.02, to $106.39/bbl.
(Michael Gibbs, Director of Equity Portfolio & Technical Strategy)
Markets:
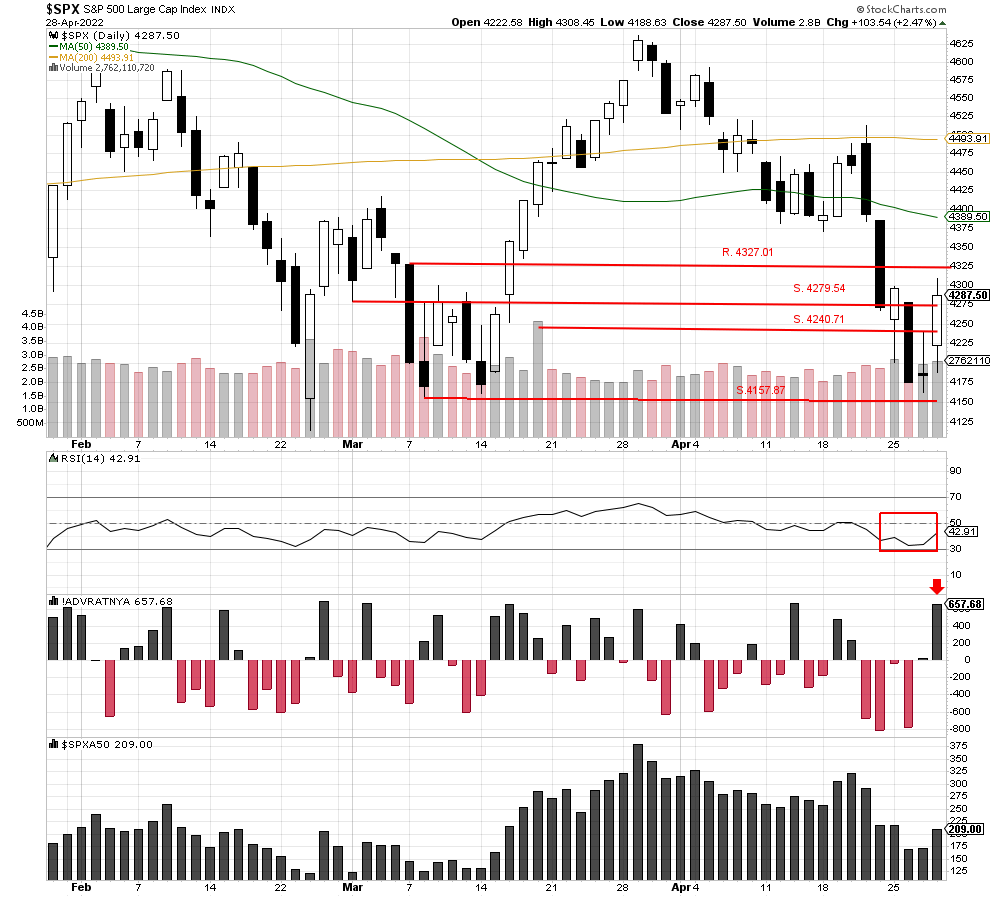
The S&P 500 rallied sharply, moving past two resistance levels, and closed higher at 4287.50. Also, RSI moved higher in support of the rally, and the Advance/Decline line also rose sharply, showing robust buying. We are encouraged by the rally because 80% of the total volume was in advancing stocks. So, if there is a follow-through day with another 80% upside volume day, a new uptrend could be forming. Potential resistance could now come in at 4327.01, and possible support is now at 4279.54.
We are currently Intermediate-term bearish and short-term bearish.
John N. Lilly III CPFA
Accredited Portfolio Management Advisor℠
Accredited Asset Management Specialist℠
Portfolio Manager, RJFS
Partner, DJWMG
Windsor Wealth Planners & Strategist
Futures trading is speculative, leveraged, and involves substantial risks. Investing always involves risk, including the loss of principal, and futures trading could present additional risk based on underlying commodities investments.
The Relative Strength Index (RSI), developed by J. Welles Wilder, is a momentum oscillator that measures the speed and changes of price movements.
The advance/decline line (A/D) is a technical indicator that plots the difference between the number of advancing and declining stocks on a daily basis. The indicator is cumulative, with a positive number being added to the prior number, or if the number is negative it is subtracted from the prior number.
The A/D line is used to show market sentiment, as it tells traders whether there are more stocks rising or falling. It is used to confirm price trends in major indexes, and can also warn of reversals when divergence occurs.
The percentage of stocks trading above a specific moving average is a breadth indicator that measures internal strength or weakness in the underlying index. The 50-day moving average is used for short-to-medium-term timeframes, while the 150-day and 200-day moving averages are used for medium-to-long-term timeframes. Signals can be derived from overbought/oversold levels, crosses above/below 50% and bullish/bearish divergences.
The Dow Jones Industrial Average (DJIA), commonly known as “The Dow” is an index representing 30 stock of companies maintained and reviewed by the editors of the Wall Street Journal. The Russell 2000 Index measures the performance of the 2,000 smallest companies in the Russell 3000 Index, which represent approximately 8% of the total market capitalization of the Russell 3000 Index.
The S&P 500 is an unmanaged index of 500 widely held stocks that is generally considered representative of the U.S stock market. Past performance may not be indicative of future results. Keep in mind that individuals cannot invest directly in any index, and index performance does not include transaction costs or other fees, which will affect actual investment performance. Individual investors’ results will vary. Opinions expressed are those of the author John N. Lilly III, and not necessarily those of Raymond James. “There is no guarantee that these statements, opinions, or forecast provided herein will prove to be correct. “The information contained was received from sources believed to be reliable, but accuracy is not guaranteed. Investing always involves risk, and you may incur a profit or loss. No investment strategy can guarantee success. The charts and/or tables presented herein are for illustrative purposes only and should not be considered as the sole basis for your investment decision. International investing involves special risks, including currency fluctuations, different financial accounting standards, and possible political and economic volatility. Investing in emerging markets can be riskier than investing in well-established foreign markets.
This is not a recommendation to buy or sell any company’s stock mentioned above.
US government bonds and treasury bills are guaranteed by the US government and, if held to maturity, offer a fixed rate of return and guaranteed principal value. US government bonds are issued and guaranteed as to the timely payment of principal and interest by the federal government. Bond prices and yields are subject to change based upon market conditions and availability. If bonds are sold prior to maturity, you may receive more or less than your initial investment. Holding bonds to term allows redemption at par value. There is an inverse relationship between interest rate movements and bond prices. Generally, when interest rates rise, bond prices fall and when interest rates fall, bond prices generally rise.