


Morning Brief

Headline News:
The S&P 500 futures are back on the rise and trade 42 points, or 0.9%, above fair value with earnings news taking the headlines. The Nasdaq 100 futures trade 1.3% above fair value after dropping 1.5% yesterday.
The growth stocks seemed to have gotten over the Netflix (NFLX 219.70, -6.49, -2.9%) disappointment yesterday after Tesla (TSLA 1049.00, +71.80, +7.4%) exceeded earnings expectations and reiterated its growth expectations. TSLA shares are up 7% in pre-market action.
The airline stocks, meanwhile, continue to fly higher after American (AAL 21.56, +2.08, +10.7%), United (UAL 50.45, +3.93, +8.5%), and Alaska Air (ALK 61.61, +2.92, +5.0%) reported encouraging results and/or provided upbeat revenue expectations.
A contrarian mindset might also be driving the futures market higher with investor sentiment having gotten too bearish in recent weeks. That could explain why AT&T (T 19.70, +0.27, +1.4%) is trading higher despite missing EPS estimates or why the uptick in Treasury yields hasn’t bothered the market.
The 2-yr yield is up four basis points to 2.61%, and the 10-yr yield is up three basis points to 2.87%. The U.S. Dollar Index is down 0.2% to 100.24. WTI crude futures are up 0.9% to $103.10/bbl.
On the data front, investors will receive weekly Initial Claims (Briefing.com consensus 195,000) and the Philadelphia Fed Index for April (Briefing.com consensus 21.0) at 8:30 a.m. ET, followed by the Conference Board’s Leading Economic Index for March (Briefing.com consensus 0.3%) at 10:00 a.m. ET.
(Michael Gibbs, Director of Equity Portfolio & Technical Strategy)
Markets:
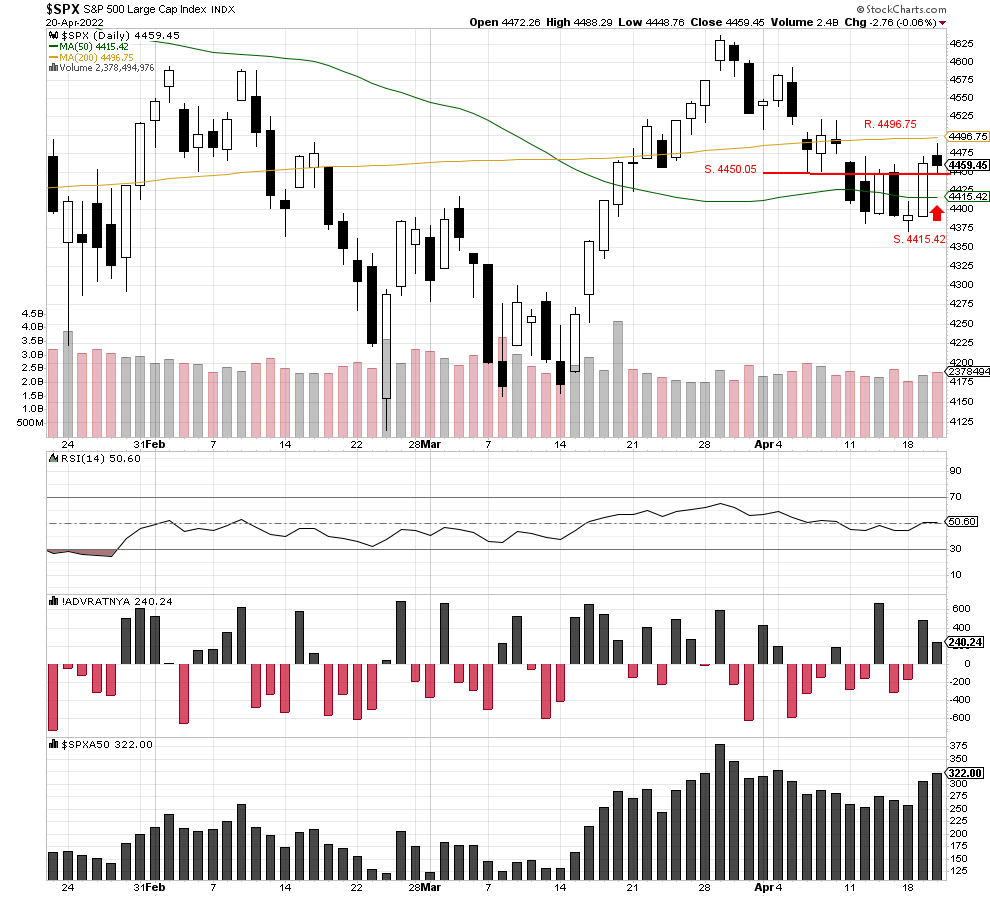
The S&P 500 closed lower at 4459.45, but the close was above old resistance at 4450.05. The index is now in a position to possibly, move back above the 200-day moving average at 4496.75. If so, we feel a new uptrend can potentially be forming. The index will need an up day with high volume, RSI closing above 50, and a close in the Advance/Decline index above 500 to confirm an uptrend. Possible support could come in at 4450.05 and then the 50-day moving average at 4415.42.
We are currently Intermediate-term bearish and short-term bearish.
John N. Lilly III CPFA
Accredited Portfolio Management Advisor℠
Accredited Asset Management Specialist℠
Portfolio Manager, RJFS
Partner, DJWMG
Windsor Wealth Planners & Strategist
Futures trading is speculative, leveraged, and involves substantial risks. Investing always involves risk, including the loss of principal, and futures trading could present additional risk based on underlying commodities investments.
The Relative Strength Index (RSI), developed by J. Welles Wilder, is a momentum oscillator that measures the speed and changes of price movements.
The advance/decline line (A/D) is a technical indicator that plots the difference between the number of advancing and declining stocks on a daily basis. The indicator is cumulative, with a positive number being added to the prior number, or if the number is negative it is subtracted from the prior number.
The A/D line is used to show market sentiment, as it tells traders whether there are more stocks rising or falling. It is used to confirm price trends in major indexes, and can also warn of reversals when divergence occurs.
The percentage of stocks trading above a specific moving average is a breadth indicator that measures internal strength or weakness in the underlying index. The 50-day moving average is used for short-to-medium-term timeframes, while the 150-day and 200-day moving averages are used for medium-to-long-term timeframes. Signals can be derived from overbought/oversold levels, crosses above/below 50% and bullish/bearish divergences.
The Dow Jones Industrial Average (DJIA), commonly known as “The Dow” is an index representing 30 stock of companies maintained and reviewed by the editors of the Wall Street Journal. The Russell 2000 Index measures the performance of the 2,000 smallest companies in the Russell 3000 Index, which represent approximately 8% of the total market capitalization of the Russell 3000 Index.
The S&P 500 is an unmanaged index of 500 widely held stocks that is generally considered representative of the U.S stock market. Past performance may not be indicative of future results. Keep in mind that individuals cannot invest directly in any index, and index performance does not include transaction costs or other fees, which will affect actual investment performance. Individual investors’ results will vary. Opinions expressed are those of the author John N. Lilly III, and not necessarily those of Raymond James. “There is no guarantee that these statements, opinions, or forecast provided herein will prove to be correct. “The information contained was received from sources believed to be reliable, but accuracy is not guaranteed. Investing always involves risk, and you may incur a profit or loss. No investment strategy can guarantee success. The charts and/or tables presented herein are for illustrative purposes only and should not be considered as the sole basis for your investment decision. International investing involves special risks, including currency fluctuations, different financial accounting standards, and possible political and economic volatility. Investing in emerging markets can be riskier than investing in well-established foreign markets.
This is not a recommendation to buy or sell any company’s stock mentioned above.
US government bonds and treasury bills are guaranteed by the US government and, if held to maturity, offer a fixed rate of return and guaranteed principal value. US government bonds are issued and guaranteed as to the timely payment of principal and interest by the federal government. Bond prices and yields are subject to change based upon market conditions and availability. If bonds are sold prior to maturity, you may receive more or less than your initial investment. Holding bonds to term allows redemption at par value. There is an inverse relationship between interest rate movements and bond prices. Generally, when interest rates rise, bond prices fall and when interest rates fall, bond prices generally rise.