


Morning Brief

Headline News:
The S&P 500 futures trade 18 points, or 0.4%, above fair value to start the week amid a carryover of positive momentum. Ostensibly, weaker oil prices ($108.09, -5.81, -5.1%) are helping risk sentiment, although they’re down on growth concerns after Shanghai imposed lockdowns to curb an outbreak of COVID-19. China’s Shanghai Composite eked out a 0.1% gain on Monday. The Treasury market is also reflecting growth concerns by way of curve-flattening activity. The 2-yr yield is up two basis points to 2.31%, while the 10-yr yield is down two basis points to 2.47%. The U.S. Dollar Index is up 0.5% to 99.25 amid relative weakness in the Japanese yen, which is down 1.6% against the dollar after the Bank of Japan offered to buy an unlimited amount of JGBs at 0.25%. That move was consistent with the central bank’s policy of yield curve control. In key corporate news, Apple (AAPL 172.84, -1.88, -1.1%) is planning to cut production for the iPhone SE by roughly 20% and AirPods by more than 10 million units this year amid geopolitical uncertainty, according to TheNikkei. Tesla (TSLA 1067.50, +56.86, +5.6%) will ask shareholders to authorize additional shares to enable another stock split. (Michael Gibbs, Director of Equity Portfolio & Technical Strategy)
Markets:
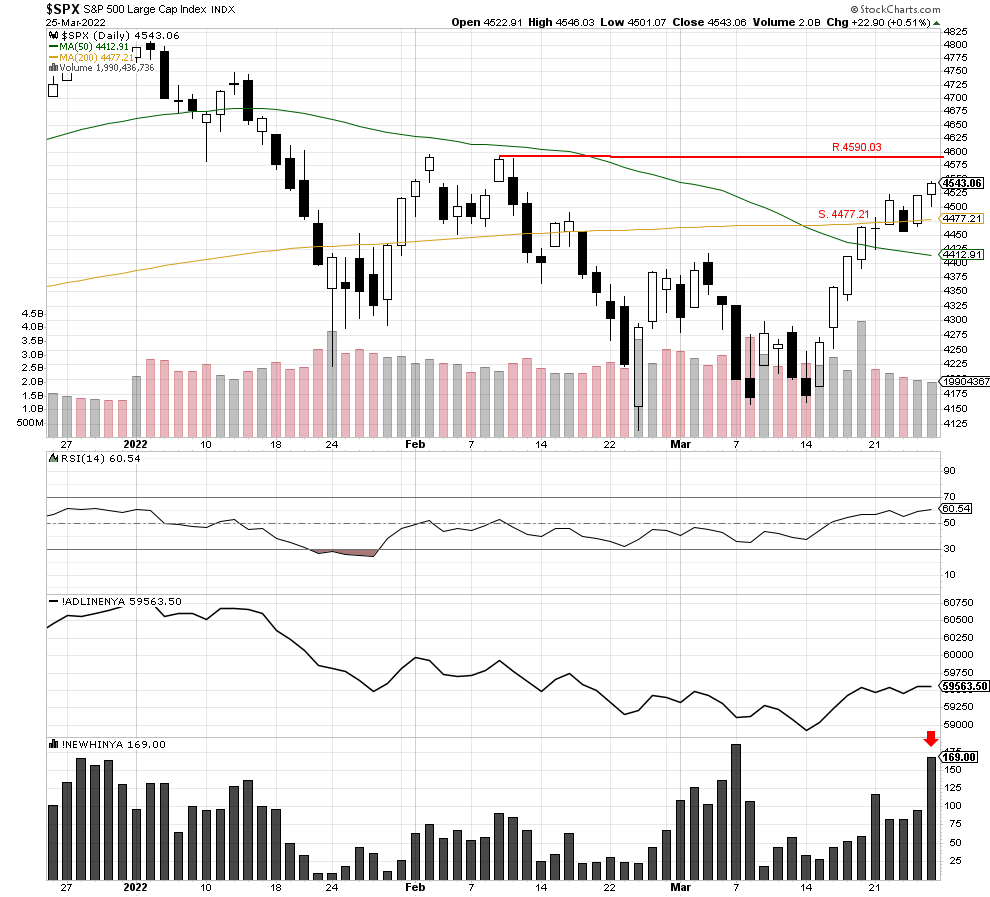
The S&P 500 moved out of a small trading range and closed higher at 4543.06. We feel the three-day base was enough of a pause for traders, and the recent uptrend could potentially continue today. If so, the index will encounter possible resistance at 4590.03 while potential support remains at the 200-day moving average of 4477.21. Meanwhile, the Net New High Index raced higher in support of the breakout of the trading range, and we are encouraged and feel markets are getting stronger by the day.
We are currently Intermediate-term bearish and short-term bullish.
John N. Lilly III CPFA
Accredited Portfolio Management Advisor℠
Accredited Asset Management Specialist℠
Portfolio Manager, RJFS
Partner, DJWMG
Windsor Wealth Planners & Strategist
Futures trading is speculative, leveraged, and involves substantial risks. Investing always involves risk, including the loss of principal, and futures trading could present additional risk based on underlying commodities investments.
The Relative Strength Index (RSI), developed by J. Welles Wilder, is a momentum oscillator that measures the speed and changes of price movements.
The advance/decline line (A/D) is a technical indicator that plots the difference between the number of advancing and declining stocks on a daily basis. The indicator is cumulative, with a positive number being added to the prior number, or if the number is negative it is subtracted from the prior number.
The A/D line is used to show market sentiment, as it tells traders whether there are more stocks rising or falling. It is used to confirm price trends in major indexes, and can also warn of reversals when divergence occurs.
Net New 52-Week Highs is a simple breadth indicator found by subtracting new lows from new highs. “New lows” is the number of stocks recording new 52-week lows. “New highs” is the number of stocks making new 52-week highs. This indicator provides an immediate score for internal strength or weakness in the market. There are more new highs when the indicator is positive, which favors the bulls. There are more new lows when the indicator is negative, which favors the bears. Chartists can analyze daily fluctuations or apply a moving average to create an oscillator that meanders above and below the zero line. Net New Highs can also be used like the AD Line by creating a High-Low Line based on cumulative Net New Highs.
The S&P 500 is an unmanaged index of 500 widely held stocks that is generally considered representative of the U.S stock market. Past performance may not be indicative of future results. Keep in mind that individuals cannot invest directly in any index, and index performance does not include transaction costs or other fees, which will affect actual investment performance. Individual investors’ results will vary. Opinions expressed are those of the author John N. Lilly III, and not necessarily those of Raymond James. “There is no guarantee that these statements, opinions, or forecast provided herein will prove to be correct. “The information contained was received from sources believed to be reliable, but accuracy is not guaranteed. Investing always involves risk, and you may incur a profit or loss. No investment strategy can guarantee success. The charts and/or tables presented herein are for illustrative purposes only and should not be considered as the sole basis for your investment decision. International investing involves special risks, including currency fluctuations, different financial accounting standards, and possible political and economic volatility. Investing in emerging markets can be riskier than investing in well-established foreign markets.
This is not a recommendation to buy or sell any company’s stock mentioned above.
US government bonds and treasury bills are guaranteed by the US government and, if held to maturity, offer a fixed rate of return and guaranteed principal value. US government bonds are issued and guaranteed as to the timely payment of principal and interest by the federal government. Bond prices and yields are subject to change based upon market conditions and availability. If bonds are sold prior to maturity, you may receive more or less than your initial investment. Holding bonds to term allows redemption at par value. There is an inverse relationship between interest rate movements and bond prices. Generally, when interest rates rise, bond prices fall and when interest rates fall, bond prices generally rise.