


Morning Brief

Headline News:
The S&P 500 futures trade 60 points, or 1.4%, above fair value in a continuation of yesterday’s rebound rally ahead of key economic data and the Fed’s policy decision. The latest Russia Ukraine headlines might be fueling the gains, even as Russia continues to launch missiles at Kyiv. Briefly, Ukraine President Zelensky said peace talks were sounding more realistic, and Russia’s foreign minister said some parts of a peace deal model are close to an agreement. Mr. Zelensky, however, acknowledged that the two sides are not close to deal while CNBC reminded viewers that Russia’s words should be taken with a grain of salt. Still, the market appears to be relishing the idea of a ceasefire agreement with talks continuing today and foreign equities sporting big gains. On a related note, President Zelensky is scheduled to speak to the U.S. Congress at 9:00 a.m. ET. As for today’s data, investors will receive Retail Sales for February (Briefing.com consensus 0.4%) and Import/Export Prices for February at 8:30 a.m. ET, followed by the NAHB Housing Market Index for March (Briefing.com consensus 81) and Business Inventories for January at 10:00 a.m. ET. The FOMC will publish its policy statement and updated economic projections at 2:00 p.m. ET, and Fed Chair Powell will discuss the Fed’s thinking at 2:30 p.m. ET. The Fed is widely expected to raise the fed funds rate by 25 basis points, so investors will listen to Mr. Powell for any hints on future rate hikes and the balance-sheet reduction process.
(Michael Gibbs, Director of Equity Portfolio & Technical Strategy)
Markets:
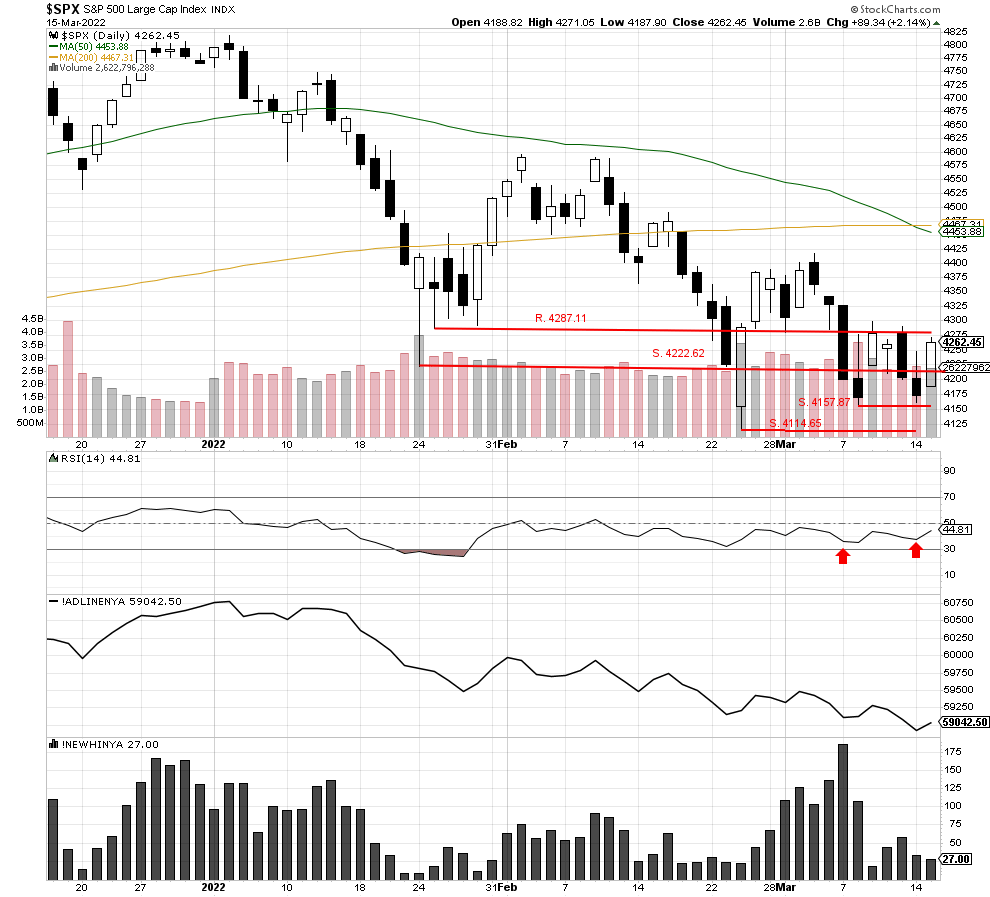
The S&P 500 rallied sharply past resistance at 4222.62 a and closed higher at 4287.11. The index is now back in the recent trading range of 4287.11-4222.262. RSI did not make a new low and has also turned higher, which is a bullish development. As of this morning, the S&P 500 is set to open higher at 4299.00 and above the current potential resistance level at 4287.11. We are encouraged that today’s close above the resistance could possibly see the index start a new uptrend.
We are currently Intermediate-term bearish and short-term bearish.
John N. Lilly III CPFA
Accredited Portfolio Management Advisor℠
Accredited Asset Management Specialist℠
Portfolio Manager, RJFS
Partner, DJWMG
Windsor Wealth Planners & Strategist
Futures trading is speculative, leveraged, and involves substantial risks. Investing always involves risk, including the loss of principal, and futures trading could present additional risk based on underlying commodities investments.
The Relative Strength Index (RSI), developed by J. Welles Wilder, is a momentum oscillator that measures the speed and changes of price movements.
The advance/decline line (A/D) is a technical indicator that plots the difference between the number of advancing and declining stocks on a daily basis. The indicator is cumulative, with a positive number being added to the prior number, or if the number is negative it is subtracted from the prior number.
The A/D line is used to show market sentiment, as it tells traders whether there are more stocks rising or falling. It is used to confirm price trends in major indexes, and can also warn of reversals when divergence occurs.
Net New 52-Week Highs is a simple breadth indicator found by subtracting new lows from new highs. “New lows” is the number of stocks recording new 52-week lows. “New highs” is the number of stocks making new 52-week highs. This indicator provides an immediate score for internal strength or weakness in the market. There are more new highs when the indicator is positive, which favors the bulls. There are more new lows when the indicator is negative, which favors the bears. Chartists can analyze daily fluctuations or apply a moving average to create an oscillator that meanders above and below the zero line. Net New Highs can also be used like the AD Line by creating a High-Low Line based on cumulative Net New Highs.
The S&P 500 is an unmanaged index of 500 widely held stocks that is generally considered representative of the U.S stock market. Past performance may not be indicative of future results. Keep in mind that individuals cannot invest directly in any index, and index performance does not include transaction costs or other fees, which will affect actual investment performance. Individual investors’ results will vary. Opinions expressed are those of the author John N. Lilly III, and not necessarily those of Raymond James. “There is no guarantee that these statements, opinions, or forecast provided herein will prove to be correct. “The information contained was received from sources believed to be reliable, but accuracy is not guaranteed. Investing always involves risk, and you may incur a profit or loss. No investment strategy can guarantee success. The charts and/or tables presented herein are for illustrative purposes only and should not be considered as the sole basis for your investment decision. International investing involves special risks, including currency fluctuations, different financial accounting standards, and possible political and economic volatility. Investing in emerging markets can be riskier than investing in well-established foreign markets.
This is not a recommendation to buy or sell any company’s stock mentioned above.
US government bonds and treasury bills are guaranteed by the US government and, if held to maturity, offer a fixed rate of return and guaranteed principal value. US government bonds are issued and guaranteed as to the timely payment of principal and interest by the federal government. Bond prices and yields are subject to change based upon market conditions and availability. If bonds are sold prior to maturity, you may receive more or less than your initial investment. Holding bonds to term allows redemption at par value. There is an inverse relationship between interest rate movements and bond prices. Generally, when interest rates rise, bond prices fall and when interest rates fall, bond prices generally rise.