


Morning Brief

Headline News:
U.S. equity index futures are down more than 2.0% after Russia attacked Ukraine with explosions reported in multiple cities. The S&P 500 futures are down 101 points and trade 2.4% below fair value, while the Nasdaq 100 futures trade 3.2% below fair value. Stocks in Asia closed sharply lower while stocks in Europe are selling off with U.S. futures — Russia’s MOEX index is down 34%, versus a 3.8% decline in the Europe Stoxx 600. Cryptocurrencies are also weak, with bitcoin down 9% to approximately $35,000. Money is flowing into safe-haven assets like the 10-yr Treasury note, which is yielding 11 basis points lower at 1.87%, as well as commodities. WTI crude futures are up 7.4% to $98.94/bbl. The 2-yr yield is down 12 basis points to 1.48%. The U.S. Dollar Index is up 1.0% to 97.11. Russian President Putin issued a dire warning to anyone who tries to interfere with Russia’s plans, while President Biden said the U.S. and allies would impose severe sanctions on Russia. Chinese state media blamed the U.S. and rejected the term “invasion,” according to CNBC. Things are looking bleak, and investors are bracing for further downside, evidenced by the 19.5% spike in the CBOE Volatility Index to 37.06. Today’s data might disappear into the background with all eyes on the Russia-Ukraine situation. Investors will receive weekly Initial Claims (Briefing.com consensus 240,000) and the second estimate for Q4 GDP (Briefing.com consensus 7.0%) at 8:30 a.m. ET, followed by New Home Sales for January (Briefing.com consensus 805,000) at 10:00 a.m. ET.
(Michael Gibbs, Director of Equity Portfolio & Technical Strategy )
Markets:
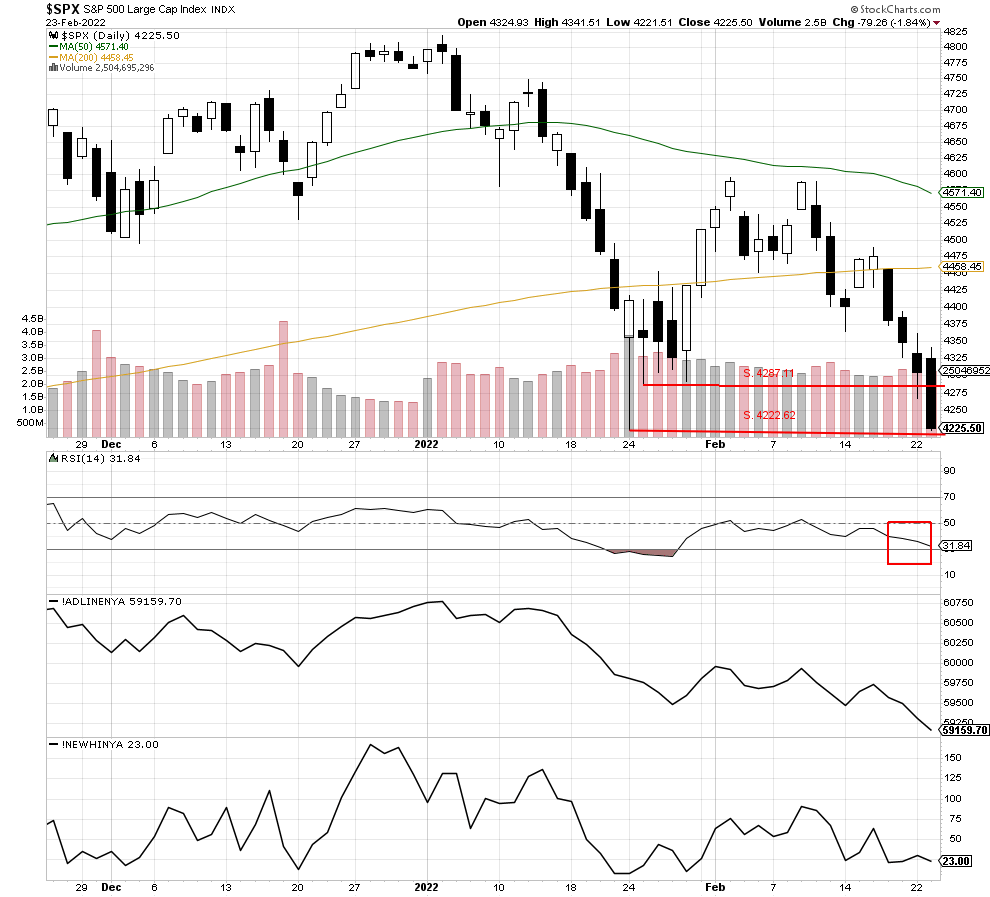
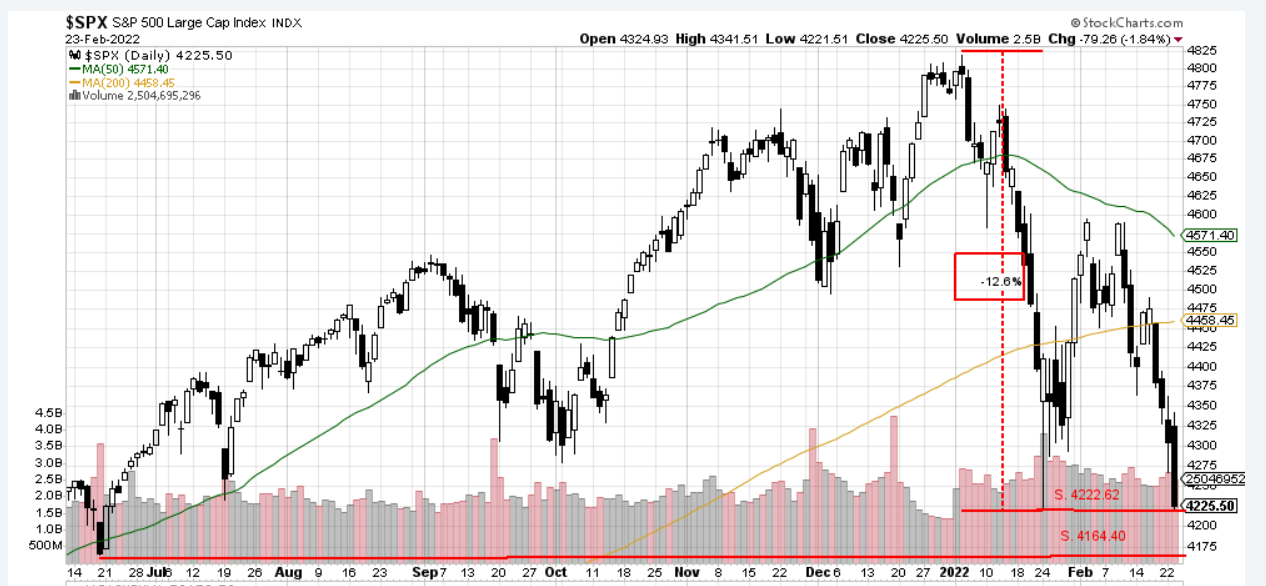
The S&P 500 sold off sharply again on Wednesday, closing at 4222.62, just above critical potential support at 4222.62. This morning the index is set to open lower at 4121.75 and race past possible support at 4164.40, which would make the low set on 5/13/2021 at 4101.25 the next potential support level. So far, the index has pulled back over 12% from the 1/4/2022 high of 4818.62. The open today will be 14% lower than that high and have the index close to the 15% correction threshold. However, the internals are getting close to oversold territory, with the RSI just above the oversold zone at 31.84, and we feel there is a chance for an oversold bounce to occur soon.
We are currently Intermediate-term bearish and short-term bearish.
John N. Lilly III CPFA
Accredited Portfolio Management Advisor℠
Accredited Asset Management Specialist℠
Portfolio Manager, RJFS
Partner, DJWMG
Windsor Wealth Planners & Strategist
Futures trading is speculative, leveraged, and involves substantial risks. Investing always involves risk, including the loss of principal, and futures trading could present additional risk based on underlying commodities investments.
The Relative Strength Index (RSI), developed by J. Welles Wilder, is a momentum oscillator that measures the speed and changes of price movements.
The advance/decline line (A/D) is a technical indicator that plots the difference between the number of advancing and declining stocks on a daily basis. The indicator is cumulative, with a positive number being added to the prior number, or if the number is negative it is subtracted from the prior number.
The A/D line is used to show market sentiment, as it tells traders whether there are more stocks rising or falling. It is used to confirm price trends in major indexes, and can also warn of reversals when divergence occurs.
Net New 52-Week Highs is a simple breadth indicator found by subtracting new lows from new highs. “New lows” is the number of stocks recording new 52-week lows. “New highs” is the number of stocks making new 52-week highs. This indicator provides an immediate score for internal strength or weakness in the market. There are more new highs when the indicator is positive, which favors the bulls. There are more new lows when the indicator is negative, which favors the bears. Chartists can analyze daily fluctuations or apply a moving average to create an oscillator that meanders above and below the zero line. Net New Highs can also be used like the AD Line by creating a High-Low Line based on cumulative Net New Highs.
The S&P 500 is an unmanaged index of 500 widely held stocks that is generally considered representative of the U.S stock market. Past performance may not be indicative of future results. Keep in mind that individuals cannot invest directly in any index, and index performance does not include transaction costs or other fees, which will affect actual investment performance. Individual investors’ results will vary. Opinions expressed are those of the author John N. Lilly III, and not necessarily those of Raymond James. “There is no guarantee that these statements, opinions, or forecast provided herein will prove to be correct. “The information contained was received from sources believed to be reliable, but accuracy is not guaranteed. Investing always involves risk, and you may incur a profit or loss. No investment strategy can guarantee success. The charts and/or tables presented herein are for illustrative purposes only and should not be considered as the sole basis for your investment decision. International investing involves special risks, including currency fluctuations, different financial accounting standards, and possible political and economic volatility. Investing in emerging markets can be riskier than investing in well-established foreign markets.
This is not a recommendation to buy or sell any company’s stock mentioned above.
US government bonds and treasury bills are guaranteed by the US government and, if held to maturity, offer a fixed rate of return and guaranteed principal value. US government bonds are issued and guaranteed as to the timely payment of principal and interest by the federal government. Bond prices and yields are subject to change based upon market conditions and availability. If bonds are sold prior to maturity, you may receive more or less than your initial investment. Holding bonds to term allows redemption at par value. There is an inverse relationship between interest rate movements and bond prices. Generally, when interest rates rise, bond prices fall and when interest rates fall, bond prices generally rise.
The Cboe Volatility Index (VIX) is a real-time index that represents the market’s expectations for the relative strength of near-term price changes of the S&P 500 index (SPX). Because it is derived from the prices of SPX index options with near-term expiration dates, it generates a 30-day forward projection of volatility. Volatility, or how fast prices change, is often seen as a way to gauge market sentiment, and in particular the degree of fear among market participants.
Nasdaq 100: The Nasdaq-100 is a stock market index made up of 101 equity securities issued by 100 of the largest non-financial companies listed on the Nasdaq stock market. It is a modified capitalization-weighted indexÐMOEX index: The MOEX Russia Index (known as MICEX Index until December of 2017) is a major stock market index which tracks the performance of the 50 largest and most liquid Russian companies from 10 main economy sectors, listed on The Moscow Stock Exchange. It is a capitalization-weighted composite index. The MOEX has a base value of 100 as of September 22, 1997.ÐEurope Stoxx 600:The STOXX Europe 600 Index is derived from the STOXX Europe Total Market Index (TMI) and is a subset of the STOXX Global 1800 Index. With a fixed number of 600 components, the STOXX Europe 600 Index represents large, mid and small capitalization companies across 17 countries of the European region: Austria, Belgium, Denmark, Finland, France, Germany, Ireland, Italy, Luxembourg, the Netherlands, Norway, Poland, Portugal, Spain, Sweden, Switzerland and the United Kingdom._