


Morning Brief

Headline News:
Wall Street is set for a flat open despite a surge in the January retail sales report. The Census Bureau reported a 3.8% increase in sales VS an expectation of a rise of only 2.1%. Excluding automobiles, gasoline, building materials, and food services, retail sales jumped by 4.8%. Meanwhile, traders continue to monitor the ongoing tensions between Russia and Ukraine. Russia claimed more troops were withdrawing, but NATO said the troop build-up was continuing on Wednesday.
Markets:
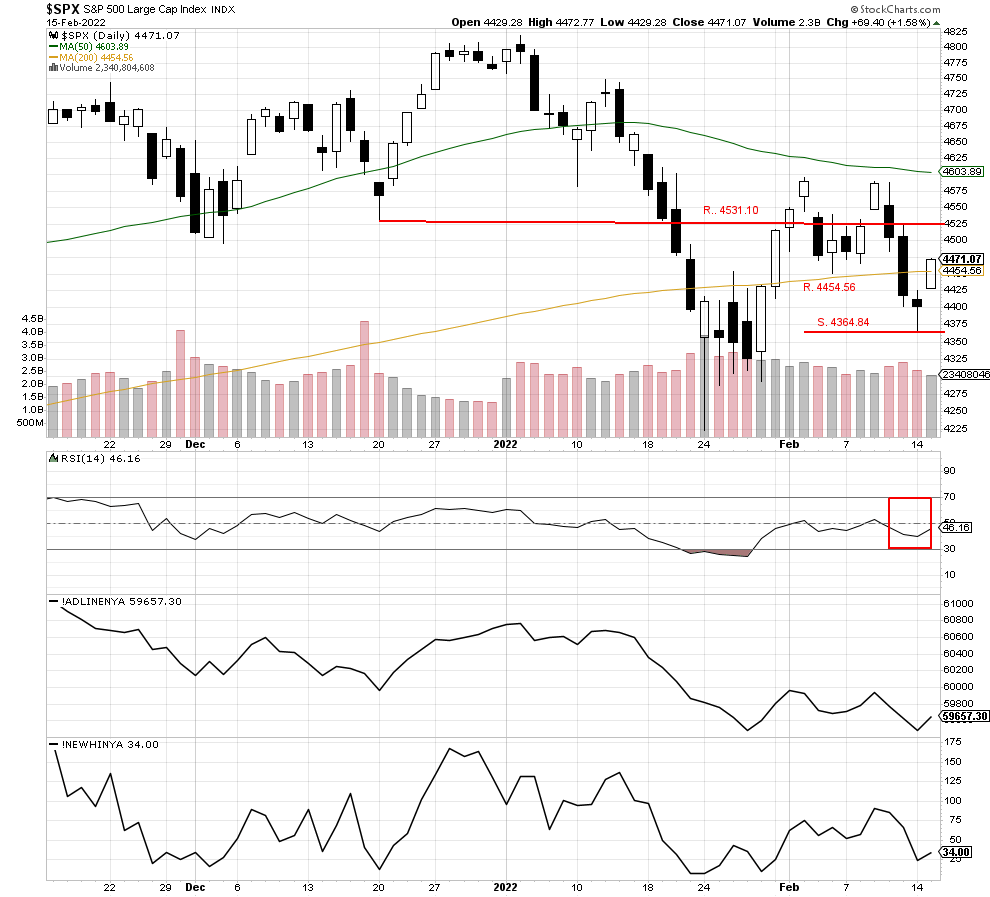
The S&P 500 rallied past the 200-day moving average at 4453.16 and closed higher at 4471.07. Up volume was 80% of the up/down, and breadth was also positive, with advancers at 77% of Adv/Dec issues. Also, the low of 4364.84 set yesterday became a higher low and is another sign of potential recovery for the index. Today, a test of possible resistance would confirm the current bullish stance. However, we feel another close above the 200-day at 4454.56 would be constructive.
We are currently Intermediate-term bullish and short-term bullish.
John N. Lilly III CPFA
Accredited Portfolio Management Advisor℠
Accredited Asset Management Specialist℠
Portfolio Manager, RJFS
Partner, DJWMG
Windsor Wealth Planners & Strategist
Futures trading is speculative, leveraged, and involves substantial risks. Investing always involves risk, including the loss of principal, and futures trading could present additional risk based on underlying commodities investments.
The Relative Strength Index (RSI), developed by J. Welles Wilder, is a momentum oscillator that measures the speed and changes of price movements.
The advance/decline line (A/D) is a technical indicator that plots the difference between the number of advancing and declining stocks on a daily basis. The indicator is cumulative, with a positive number being added to the prior number, or if the number is negative it is subtracted from the prior number.
The A/D line is used to show market sentiment, as it tells traders whether there are more stocks rising or falling. It is used to confirm price trends in major indexes, and can also warn of reversals when divergence occurs.
Net New 52-Week Highs is a simple breadth indicator found by subtracting new lows from new highs. “New lows” is the number of stocks recording new 52-week lows. “New highs” is the number of stocks making new 52-week highs. This indicator provides an immediate score for internal strength or weakness in the market. There are more new highs when the indicator is positive, which favors the bulls. There are more new lows when the indicator is negative, which favors the bears. Chartists can analyze daily fluctuations or apply a moving average to create an oscillator that meanders above and below the zero line. Net New Highs can also be used like the AD Line by creating a High-Low Line based on cumulative Net New Highs.
The S&P 500 is an unmanaged index of 500 widely held stocks that is generally considered representative of the U.S stock market. Past performance may not be indicative of future results. Keep in mind that individuals cannot invest directly in any index, and index performance does not include transaction costs or other fees, which will affect actual investment performance. Individual investors’ results will vary. Opinions expressed are those of the author John N. Lilly III, and not necessarily those of Raymond James. “There is no guarantee that these statements, opinions, or forecast provided herein will prove to be correct. “The information contained was received from sources believed to be reliable, but accuracy is not guaranteed. Investing always involves risk, and you may incur a profit or loss. No investment strategy can guarantee success. The charts and/or tables presented herein are for illustrative purposes only and should not be considered as the sole basis for your investment decision. International investing involves special risks, including currency fluctuations, different financial accounting standards, and possible political and economic volatility. Investing in emerging markets can be riskier than investing in well-established foreign markets.
This is not a recommendation to buy or sell any company’s stock mentioned above.
US government bonds and treasury bills are guaranteed by the US government and, if held to maturity, offer a fixed rate of return and guaranteed principal value. US government bonds are issued and guaranteed as to the timely payment of principal and interest by the federal government. Bond prices and yields are subject to change based upon market conditions and availability. If bonds are sold prior to maturity, you may receive more or less than your initial investment. Holding bonds to term allows redemption at par value. There is an inverse relationship between interest rate movements and bond prices. Generally, when interest rates rise, bond prices fall and when interest rates fall, bond prices generally rise.