


Daily Commentary
![]()
Headline News:
U.S. stock futures were little changed as investors waited for key economic data releases and the start of the two-day Federal Reserve meeting. The U.S. retail sales report could show a strong consumer when released later today. Also, the industrial production, along with the U.S. Redbook, will be reported and could also give clues to the health of the U.S. economy. The closely watched 10- Treasury yield was lower at 1.59% in pre-market trading.
Markets:
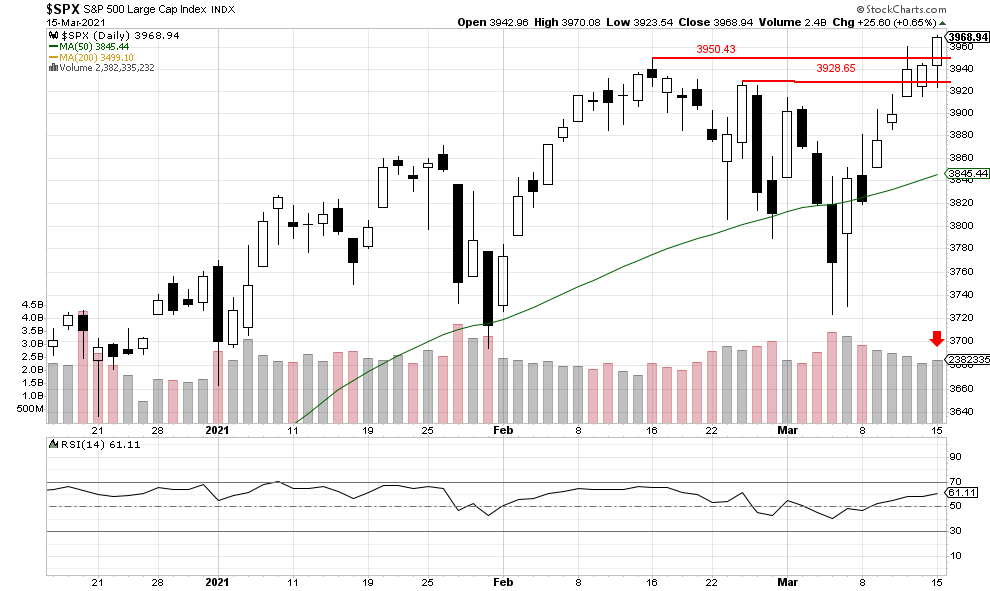
The S&P 500 closed at a new all-time high of 3968.94 after moving past the last line of resistance on Monday. The index is now in rare air, where there is currently no overhead resistance. The trading came with a small pick up in volume with 2,382,335,232 shares traded. Potential support could now come in at 3960.27 and then possibly 3950.43. Volume for advancing issues was only 61%, so it appears a sense of complacency has potentially set in. We would still like to see a more prominent base form before a continuation of the recent rally.
We are currently long-term bullish and short-term bullish.
John N. Lilly III CPFA
Accredited Portfolio Management Advisor℠
Accredited Asset Management Specialist℠
Portfolio Manager, RJ
Partner, DJWMG
Windsor Wealth Planners & Strategist
Futures trading is speculative, leveraged, and involves substantial risks. Investing always involves risk, including the loss of principal, and futures trading could present additional risk based on underlying commodities investments.
The Relative Strength Index (RSI), developed by J. Welles Wilder, is a momentum oscillator that measures the speed and changes of price movements.
The S&P 500 is an unmanaged index of 500 widely held stocks that is generally considered representative of the U.S stock market. Past performance may not be indicative of future results. Keep in mind that individuals cannot invest directly in any index, and index performance does not include transaction costs or other fees, which will affect actual investment performance. Individual investors’ results will vary. Opinions expressed are those of the author John N. Lilly III, and not necessarily those of Raymond James. “There is no guarantee that these statements, opinions, or forecast provided herein will prove to be correct. “The information contained was received from sources believed to be reliable, but accuracy is not guaranteed. Investing always involves risk, and you may incur a profit or loss. No investment strategy can guarantee success. The charts and/or tables presented herein are for illustrative purposes only and should not be considered as the sole basis for your investment decision. International investing involves special risks, including currency fluctuations, different financial accounting standards, and possible political and economic volatility. Investing in emerging markets can be riskier than investing in well-established foreign markets.
This is not a recommendation to buy or sell any company’s stock mentioned above.
US government bonds and treasury bills are guaranteed by the US government and, if held to maturity, offer a fixed rate of return and guaranteed principal value. US government bonds are issued and guaranteed as to the timely payment of principal and interest by the federal government. Bond prices and yields are subject to change based upon market conditions and availability. If bonds are sold prior to maturity, you may receive more or less than your initial investment. Holding bonds to term allows redemption at par value. There is an inverse relationship between interest rate movements and bond prices. Generally, when interest rates rise, bond prices fall and when interest rates fall, bond prices generally rise.
Retail sales measure the total receipts at stores that sell merchandise and related services to final consumers. Sales are by retail and food services stores. Data are collected from the Monthly Retail Trade Survey conducted by the U.S. Bureau of the Census. Essentially, retail sales cover the durables and nondurables portions of consumer spending. Consumer spending typically accounts for about two-thirds of GDP and is therefore a key element in economic growth. Of special attention is the control group; this is an input into the consumer spending component of GDP and excludes food services, autos, gasoline and building materials.
The Federal Reserve’s monthly index of industrial production and the related capacity indexes and capacity utilization rates cover manufacturing, mining, and electric and gas utilities. The industrial sector, together with construction, accounts for the bulk of the variation in national output over the course of the business cycle. The production index measures real output and is expressed as a percentage of real output in a base year, currently 2012. The capacity index, which is an estimate of sustainable potential output, is also expressed as a percentage of actual output in 2012. The rate of capacity utilization equals the seasonally adjusted output index expressed as a percentage of the related capacity index.
The index of industrial production is available nationally by market and industry groupings. The major groupings are comprised of final products (such as consumer goods, business equipment and construction supplies), intermediate products and materials. The industry groupings are manufacturing (further subdivided into durable and nondurable goods), mining and utilities. The capacity utilization rate — reflecting the resource utilization of the nation’s output facilities — is available for the same market and industry groupings.
Industrial production was also revised to NAICS (North American Industry Classification System) in the early 2000s. Unlike other economic series that lost much historical data prior to 1992, the Federal Reserve Board was able to reconstruct historical data that go back more than 30 years
A weekly measure of comparable store sales at chain stores, discounters, and department stores. Redbook tracks week-to-week change, month-to-date change, and year-on-year change with the latter the most closely watched reading. The report, produced by Redbook Research, offers early indications on ex-auto ex-gas retail sales.