Daily Commentary
Headline News:
U.S. stock futures are higher after a positive January jobs report and progress on a new economic stimulus package progress. President Biden’s $1.9 trillion aid bill is now more likely after the U.S. Senate approved a budget plan allowing for the legislation to pass in the coming weeks. The Labor Department’s Nonfarm Payrolls report showed 49,000 new jobs in January, and the unemployment rate fell to 6.3%. The news has investors in a bullish mood as the data continues to show the U.S. economy is slowing getting stronger after starting to reopen.
Markets:
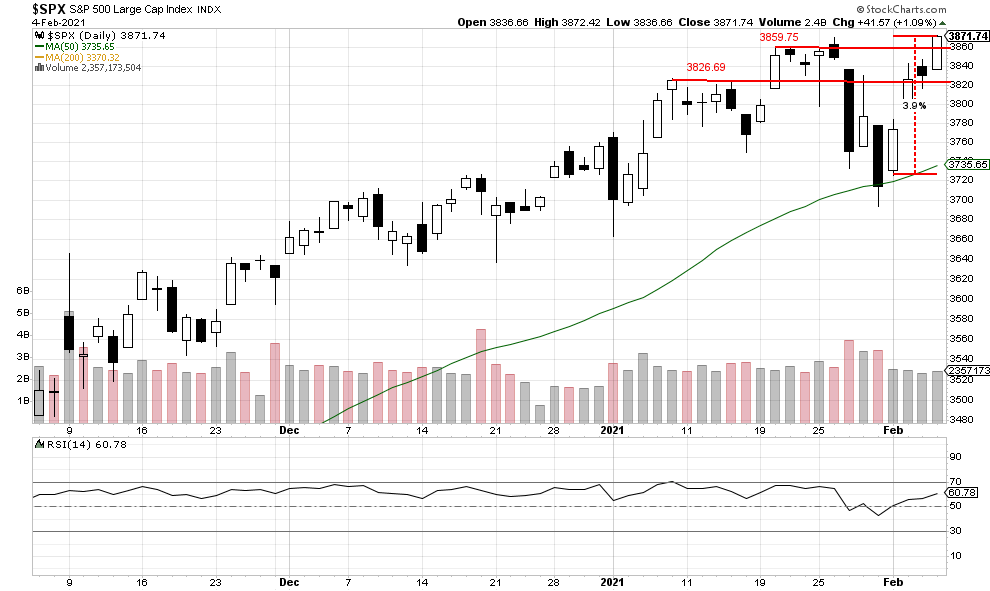
The S&P 500 rallied past the last line of resistance at 3859.75 and closed at a new all-time high of 3871.74. The move did come on lower volume with 2,357,173,504 shares trade, and RSI moved higher is support closing at 60.78. The index rallied close to 4% this week with little rest, so we feel some profit-taking may come in to close out the week. If so, we also feel it will be a potential buying opportunity. Possible support should come in at 3859.75, which should hold today.
We are currently long-term bullish and short-term bullish.
John N. Lilly III CPFA
Accredited Portfolio Management Advisor℠
Accredited Asset Management Specialist℠
Portfolio Manager, RJ
Partner, DJWMG
Windsor Wealth Planners & Strategist
Futures trading is speculative, leveraged, and involves substantial risks. Investing always involves risk, including the loss of principal, and futures trading could present additional risk based on underlying commodities investments.
The Relative Strength Index (RSI), developed by J. Welles Wilder, is a momentum oscillator that measures the speed and changes of price movements.
The S&P 500 is an unmanaged index of 500 widely held stocks that is generally considered representative of the U.S stock market. Past performance may not be indicative of future results. Keep in mind that individuals cannot invest directly in any index, and index performance does not include transaction costs or other fees, which will affect actual investment performance. Individual investors’ results will vary. Opinions expressed are those of the author John N. Lilly III, and not necessarily those of Raymond James. “There is no guarantee that these statements, opinions, or forecast provided herein will prove to be correct. “The information contained was received from sources believed to be reliable, but accuracy is not guaranteed. Investing always involves risk, and you may incur a profit or loss. No investment strategy can guarantee success. The charts and/or tables presented herein are for illustrative purposes only and should not be considered as the sole basis for your investment decision. International investing involves special risks, including currency fluctuations, different financial accounting standards, and possible political and economic volatility. Investing in emerging markets can be riskier than investing in well-established foreign markets.
This is not a recommendation to buy or sell any company’s stock mentioned above.
The most closely watched of all economic indicators, the employment situation is a set of monthly labor market indicators based on two separate reports: the establishment survey which tracks 650,000 worksites and offers the nonfarm payroll and average hourly earnings headlines and the household survey which interviews 60,000 households and generates the unemployment rate.
Nonfarm payrolls track the number of part-time and full-time employees in both business and government. Average hourly earnings track employee pay while the average workweek, also part of the establishment survey, tracks the number of hours worked. The report’s private payroll measure excludes government workers.
The unemployment rate measures the number of unemployed as a percentage of the labor force. In order to be counted as unemployed, one must be actively looking for work. Other commonly known data from the household survey include the labor supply and discouraged workers


