


Morning Brief

Headline News:
Equity futures point to a higher opening this morning after the S&P 500 and Nasdaq Composite set fresh record highs for the second consecutive session in yesterday’s action. Though the gains at the index level were more modest than in recent sessions, participation broadened, and investors were quick to buy the dip amid early tech weakness, helping the Nasdaq Composite notch its 12th straight session of higher finishes.
Headlines are relatively quiet again today, though the path of least resistance continues to point higher as stocks have yet to face any real selling interest since the major averages finished recovering losses incurred since the start of the war in Iran. The geopolitical backdrop remains constructive, with the U.S. and Iran likely to resume talks over the weekend, while Israel and Lebanon agreed on a 10-day ceasefire. President Trump reiterated his view that the war should be over soon at an event in Las Vegas.
Oil prices moved higher yesterday, but WTI crude is currently down $3.21 (-3.5%) to $87.96 per barrel.
Corporate news flow is on the lighter side this morning, though the market has another slate of earnings reports to assess.
There are no economic data releases scheduled for today.
(Michael Gibbs, Managing Director, Lead Portfolio Manager |)
Markets:
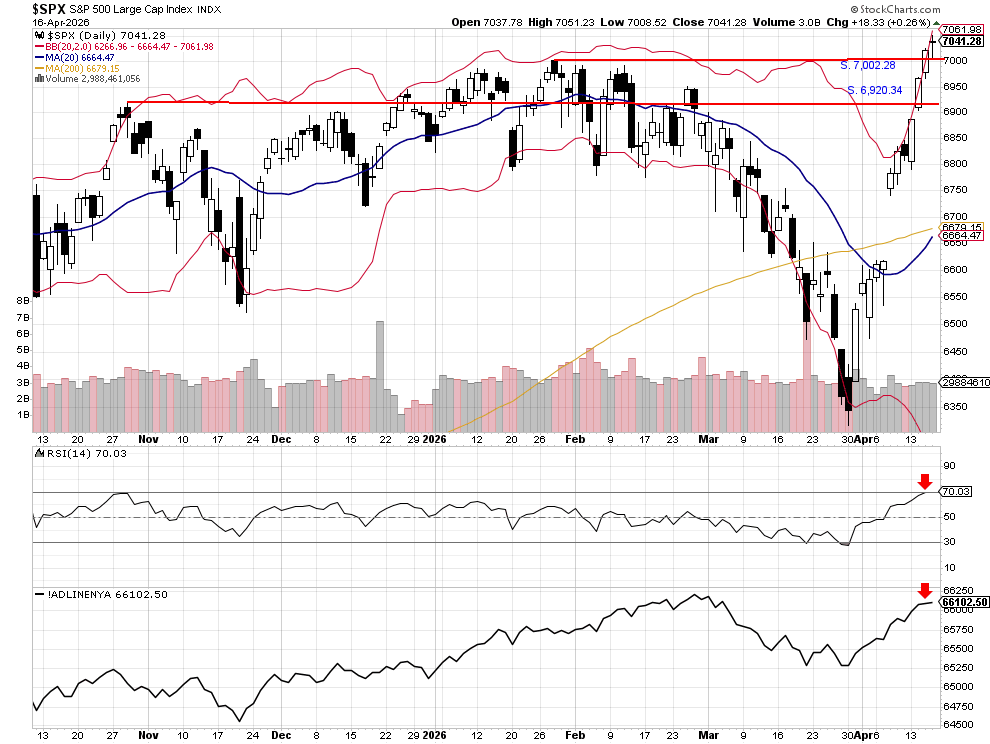
The S&P 500 closed at another new all-time high of 7,041.28, although sellers did emerge near 7,051.23. The index remains pinned at the upper Bollinger Band, and the RSI moved into overbought territory for the first time in this rally. From a technical standpoint, that suggests the market is becoming stretched and vulnerable to near-term selling pressure.
However, Brent crude oil is down to $95.23 a barrel this morning, which has helped lift S&P 500 futures by 0.50% ahead of the open. In addition, growing talk of a potential deal with Iran to end the war is adding to the positive tone and could support equities in early trading.
Even so, with the S&P 500 extended and now overbought, we would expect sellers to step in at some point today, limiting further upside.
John N. Lilly III CPFA
Accredited Portfolio Management Advisor℠
Accredited Asset Management Specialist℠
Portfolio Manager, RJFS
Partner, DJWMG
Windsor Wealth Planners & Strategists
Futures trading is speculative, leveraged, and involves substantial risks. Investing always involves risk, including the loss of principal, and futures trading could present additional risk based on underlying commodities investments.
The Relative Strength Index (RSI), developed by J. Welles Wilder, is a momentum oscillator that measures the speed and changes of price movements.
The percentage of stocks trading above a specific moving average is a breadth indicator that measures internal strength or weakness in the underlying index. The 50-day moving averages are used for short-to-medium-term timeframes, while the 150-day and 200-day moving averages are used for medium-to-long-term ones. Signals can be derived from overbought/oversold levels, crosses above/below 50%, and bullish/bearish divergences.
The Dow Jones Industrial Average (DJIA), commonly known as “The Dow,” is an index representing 30 stocks of companies maintained and reviewed by the editors of the Wall Street Journal. The Russell 2000 Index measures the performance of the 2,000 smallest companies in the Russell 3000 Index, which represents approximately 8% of the total market capitalization of the Russell 3000 Index.
The S&P 500 is an unmanaged index of 500 widely held stocks that is generally considered representative of the U.S. stock market. Past performance may not be indicative of future results. Keep in mind that individuals cannot invest directly in any index, and index performance does not include transaction costs or other fees, which will affect actual investment performance. Individual investors’ results will vary. Opinions expressed are those of the author, John N. Lilly III, and not necessarily those of Raymond James. “There is no guarantee that these statements, opinions, or forecast provided herein will prove to be correct. “The information contained was received from sources believed to be reliable, but accuracy is not guaranteed. Investing always involves risk, and you may incur a profit or loss. No investment strategy can guarantee success. The charts and/or tables presented herein are for illustrative purposes only and should not be considered as the sole basis for your investment decision. International investing involves special risks, including currency fluctuations, different financial accounting standards, and possible political and economic volatility. Investing in emerging markets can be riskier than investing in well-established foreign markets.
This is not a recommendation to buy or sell any company’s stock mentioned above.
US government bonds and treasury bills are guaranteed by the US government and, if held to maturity, offer a fixed rate of return and guaranteed principal value. US government bonds are issued and guaranteed due to the federal government’s timely principal and interest payment. Bond prices and yields are subject to change based on market conditions and availability. If bonds are sold prior to maturity, you may receive more or less than your initial investment. Holding bonds to term allows redemption at par value. There is an inverse relationship between interest rate movements and bond prices. Generally, when interest rates rise, bond prices fall, and when interest rates fall, bond prices generally rise.
The Nasdaq 100 (^NDX) is a stock market index made up of 103 equity securities issued by 100 of the largest non-financial companies listed on the NASDAQ. It is a modified capitalization-weighted index. It is based on exchange and not an index of U.S.-based companies.
The Russell 2000 Index is a stock market index that measures the performance of the 2,000 smaller companies included in the Russell 3000 Index. It is managed by London’s FTSE Russell Group and is widely regarded as a bellwether of the U.S. economy because it focuses on smaller companies that focus on the U.S. market.
The NYSE advance/decline measure refers to the number of common stocks listed on the New York Stock Exchange (NYSE) that close at a higher price than their previous closing price (“advancing issues”) compared to the number of NYSE-listed common stocks that close at a lower price than their previous closing price (“declining issues”) during a specified trading session.
This measure is used as an indicator of market breadth and reflects the extent to which price movements are broadly distributed among NYSE-listed securities.