


Morning Brief

Headline News:
The Federal Reserve’s primary price gauge rose at its highest core level since 2023, reinforcing the central bank’s recent tough talk on inflation.
Excluding food and energy, the personal consumption expenditures price index showed a 3.4% annual rate after rising 0.3% for the month, both in line with Dow Jones consensus. The core reading was the highest since October 2023.
For the all-items reading, the PCE index showed inflation running at a seasonally adjusted 4.1% annual rate, the highest since April 2023, according to a Commerce Department report Thursday. On a monthly basis, PCE accelerated 0.4%. The annual level was in line with the Dow Jones consensus estimate while the monthly reading was 0.1 percentage point below.
While Fed officials look at both headline and core rates, they generally consider the latter a better measure of long-run trends, particularly in light of this year’s inflation surge that was driven largely by an acceleration in energy prices tied to the Iran war that have slowly been seeping into other parts of the economy.
The report comes a little more than a week after the Fed and new Chairman Kevin Warsh delivered what markets widely viewed as a tough talk on rates and inflation.
(Jeff Cox, CNBC)
Markets:
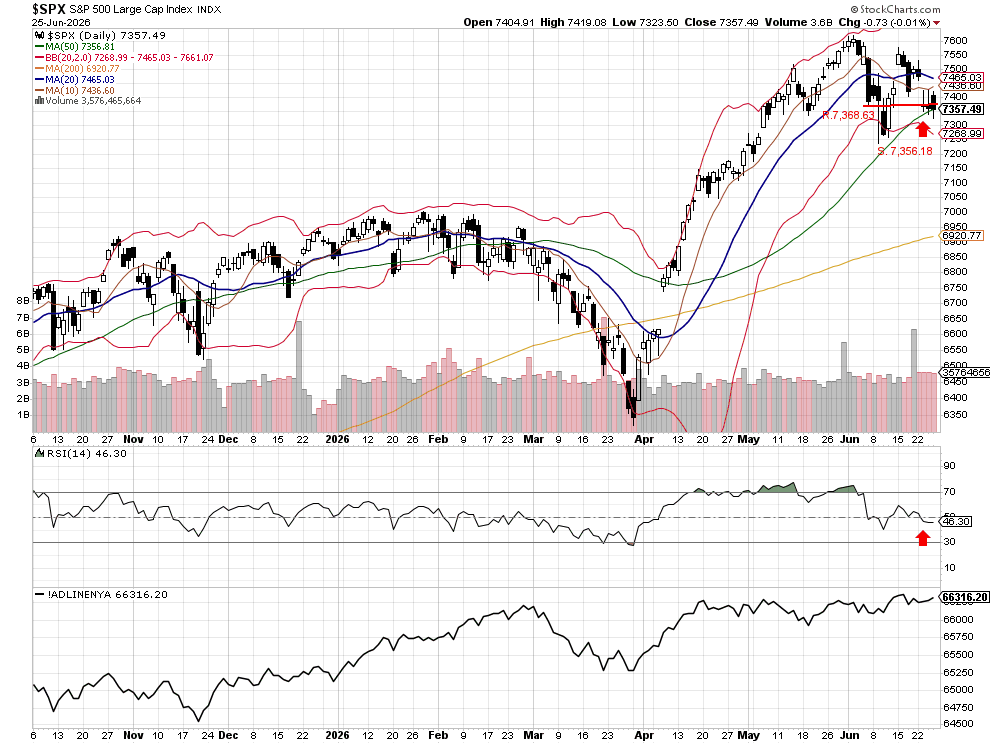
The S&P 500 closed lower at 7,358.22, finishing just above the critical support level at the 50-day moving average of 7,349.01. Although the index briefly broke this level below during the session, buyers stepped in quickly, allowing the market to recover and defend this important area of support by the close.
The technical indicators presented a mixed picture. The RSI remained below the neutral 50 level, closing at 46.34, reflecting continued weakening momentum. However, the Advance/Decline Line held steady and did not confirm the day’s selling pressure, suggesting that market breadth remains relatively resilient.
Another positive development came from the bond market. The U.S. 10-year Treasury yield closed below its long-term support level of 4.44%, finishing at 4.37%. Lower interest rates are generally supportive of higher equity valuations and could provide a tailwind for stocks, even as inflation remains above normal levels.
This morning, S&P 500 futures are up 0.86%, suggesting buyers have regained the early advantage. A strong open followed by a decisive move above the 50-day moving average would reinforce the view that yesterday’s successful defense of support may have marked the beginning of a short-term rebound.
John N. Lilly III CPFA
Accredited Portfolio Management Advisor℠
Accredited Asset Management Specialist℠
Portfolio Manager, RJFS
Partner, DJWMG
Windsor Wealth Planners & Strategists
Futures trading is speculative, leveraged, and involves substantial risks. Investing always involves risk, including the loss of principal, and futures trading may present additional risk due to the underlying commodity exposure.
The Relative Strength Index (RSI), developed by J. Welles Wilder, is a momentum oscillator that measures the speed and changes of price movements.
The percentage of stocks trading above a specific moving average is a breadth indicator that measures the underlying index’s internal strength or weakness. The 50-day moving average is used for short- to medium-term timeframes, while the 150-day and 200-day moving averages are used for medium- to long-term timeframes. Signals can be derived from overbought/oversold levels, crosses above/below 50%, and bullish/bearish divergences.
The Dow Jones Industrial Average (DJIA), commonly known as “The Dow,” is an index representing 30 stocks of companies maintained and reviewed by the editors of the Wall Street Journal. The Russell 2000 Index measures the performance of the 2,000 smallest companies in the Russell 3000 Index, which represents approximately 8% of the Russell 3000 Index’s total market capitalization.
The S&P 500 is an unmanaged index of 500 widely held stocks that is generally considered representative of the U.S. stock market. Past performance may not be indicative of future results. Keep in mind that individuals cannot invest directly in any index, and index performance does not include transaction costs or other fees, which will affect actual investment performance. Individual investors’ results will vary. Opinions expressed are those of the author, John N. Lilly III, and not necessarily those of Raymond James. “There is no guarantee that these statements, opinions, or forecast provided herein will prove to be correct. “The information contained was received from sources believed to be reliable, but accuracy is not guaranteed. Investing always involves risk, and you may incur a profit or loss. No investment strategy can guarantee success. The charts and/or tables presented herein are for illustrative purposes only and should not be considered as the sole basis for your investment decision. International investing involves special risks, including currency fluctuations, different financial accounting standards, and possible political and economic volatility. Investing in emerging markets can be riskier than investing in well-established foreign markets.
This is not a recommendation to buy or sell any company’s stock mentioned above.
US government bonds and treasury bills are guaranteed by the US government and, if held to maturity, offer a fixed rate of return and guaranteed principal value. US government bonds are issued and guaranteed by the federal government’s timely payment of principal and interest. Bond prices and yields are subject to change based on market conditions and availability. If bonds are sold prior to maturity, you may receive more or less than your initial investment. Holding bonds to term allows redemption at par value. There is an inverse relationship between interest rate movements and bond prices. Generally, when interest rates rise, bond prices fall, and when interest rates fall, bond prices generally rise.
The Nasdaq 100 (^NDX) is a stock market index comprising 103 equity securities of 100 of the largest non-financial companies listed on the NASDAQ. It is a modified capitalization-weighted index. It is based on exchange and not an index of U.S.-based companies.
The Russell 2000 Index is a stock market index that measures the performance of the 2,000 smaller companies included in the Russell 3000 Index. It is managed by London’s FTSE Russell Group and is widely regarded as a bellwether of the U.S. economy because it tracks smaller companies that operate in the U.S. market.
The NYSE advance/decline measure refers to the number of common stocks listed on the New York Stock Exchange (NYSE) that close at a higher price than their previous closing price (“advancing issues”) compared to the number of NYSE-listed common stocks that close at a lower price than their previous closing price (“declining issues”) during a specified trading session.
This measure serves as an indicator of market breadth and reflects the extent to which price movements are broadly distributed across NYSE-listed securities.